
Abstract
Modeling Photosynthesis of Spartina alterniflora (smooth cordgrass ) Impacted by the Deepwater Horizon Oil Spill Using Bayesian Inference Wei Wu, Patrick D. Biber , Mark S. Peterson , Chongfeng Gong

Abstract
E N D
Presentation Transcript
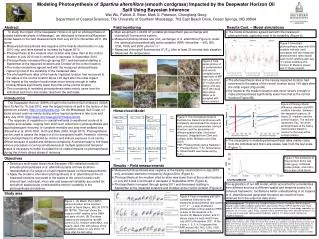
Modeling Photosynthesis of Spartinaalterniflora (smooth cordgrass) Impacted by the Deepwater Horizon Oil Spill Using Bayesian Inference Wei Wu, Patrick D. Biber, Mark S. Peterson, Chongfeng Gong Department of Coastal Sciences, The University of Southern Mississippi, 703 East Beach Drive, Ocean Springs, MS 39564 Data Model PARijkl Pijkl Tijk Sijk Timei Locm Loch (zijkl) fL(β0ijk, β1) fK(α0ij, α1, α2) fMS(θ0, θ1, θ2, θ3) Process Model Process uncertainty σL2 Process uncertainty σK2 Process uncertainty σMS2 Abstract Field monitoring Results Cont. – Model simulations • To study the impact of the Deepwater Horizon oil spill on photosynthesis of coastal saltmarsh plants in Mississippi, we developed a hierarchical Bayesian model based on the field measurements from July 2010 to November 2011. We found: • Measured photosynthesis was negative at the heavily oiled location in July 2010 only, and rates started to increase by August 2010. • Photosynthesis at the medium oiled location was lower than at the control location in July 2010 and it continued to decrease in September 2010. • Photosynthesis increased through spring 2011 and decreased starting in September at the impacted locations and October at the control location. • The model simulations agreed well with the measured photosynthesis, capturing most of the variability of the measured data. • The photosynthesis rates at the heavily impacted location had recovered to the status of the control location about 140 days after the initial impact. • the impact at the medium location was never severe enough to make photosynthesis significantly lower than that at the control location. • The uncertainty in modeling photosynthesis rates mainly came from the individual and micro-site scales, less from the leaf scale. • Main equipment: LI-6400 XT portable photosynthetic gas exchange and chlorophyll fluorescence system. • Measured photosynthesis rate (CO2 exchange) of S. alterniflora(Figure 2) under five identical photosynthetically active radiation (PAR) intensities: ~ 400, 800, 1200, 1600, and 2000 μmol m-2s-1. • Measured chlorophyll fluorescence (Fv/Fm) after at least 30 minutes dark adaption. • Measured Air temperature. • The model simulations agreed well with the measured photosynthesis, capturing most of its variability (Figure 5). Parameters β1 β0ijk α1 α2 α0ij θ1 θ2 θ3 θ0 Estimation errors Estimation errors Estimation errors Figure 5 Simulated photosynthesis rates with 95% credible intervals (red) contrasted with the measured photosynthesis rates (black) each month (starting with July “J”) at the locations of A: Control, B: Medium impact, and C: Heavy impact. Micro-site and temporal (MS) Global Leaf (L) Individual (K) A B C Figure 2 Time series photos of oil contamination and smooth cordgrass plant responses at MP from July 2010 (2-13 days after oiling) until July 2011 (351 days after oiling). (Biber et al., accepted with minor revision) • The photosynthesis rates at the heavily impacted location had recovered to the status of the control location about 140 days after the initial impact (Figure 6A). • the impact at the medium location was never severe enough to make photosynthesis significantly lower than that at the control location (Figure 6B). Introduction The Deepwater Horizon (DWH) oil spill in the northern Gulf of Mexico (GOM), from 20 April to 15 July 2010, was the largest marine oil spill in the history of the petroleum industry (http://en.wikipedia.org). On the Mississippi Gulf Coast, oil slicks arrived onshore mainly during active tropical systems in late June and early July 2010 (http://www.nhc.noaa.gov/2010atlan.shtml). The response of vegetation in coastal wetlands to weathered crude oil is complex and variable, ranging from short-term reductions in photosynthesis and rapid subsequent recovery, to complete mortality and long-term wetland loss (Pezeshki et al. 2000, 2001, Roth and Baltz 2009, Engle 2011). Photosynthesis can be used to assess the impact of oil on ecosystem health. However, inferring how photosynthesis is affected by chronic and indirect exposure to oil can be difficult because of spatial and temporal complexity. A coherent way to link these various processes occurring simultaneously at multiple spatial and temporal scales is necessary to better elucidate the oil-related impacts on photosynthesis during the chronic stress phase of recovery. Figure 6 Photosynthesis difference (median and 95% credible intervals) between the impacted locations (A: heavy; B: medium) and the control location. The red line represents Day 140 when photosynthesis at the heavy oiled location stated to recover to the level at the control location. Photosynthesis rate (μmol C s-1 m-2) Hierarchical Model A B Medium - Control Figure 3. The conceptual model to illustrate the hierarchical structure with complexity decomposed into stages of data, process and parameters (vertical direction) and the association of different spatial scales (horizontal direction). (Adapted from Clark and LaDeau 2006, McMahon and Diez 2007). PAR: Photosynthetic Active Radiation; P: Photosynthesis; T: Air Temperature; S: Stress/health level measured by Fv/Fm. Heavy - Control • The uncertainty in modeling photosynthesis rates mainly came from the individual and micro-site scales, less from the leaf scale (Figure 7). • J A S ONDJ FMAMJJ A SON J A SONDJ FMAMJJ ASON J A S ONDJF MAMJJ A SON Objectives Figure 7 The posteriors of the precision at the leaf scale (grey), individual scales (black), and micro-site scales (thick black). • Develop a multi-scale hierarchical Bayesian (HB) statistical model to simulate photosynthesis of S. alternifloraplants at three locations representative of a range of oil spill impacts based on field measurements; • Apply the model to infer when photosynthesis of S. alternifloraat the oil impacted locations recovered to the status of the control location with inherent leaf, individual, micro-site and seasonal variability accounted for, and which spatial scale contributed the most to variability in the photosynthesis simulations. Results – Field measurements • Measured photosynthesis was negative at the heavily oiled location in July 2010 only, and rates started to increase by August 2010 (Figure 4). • Photosynthesis at the medium oiled location was lower than at the control location in July 2010 and it continued to decrease in September 2010 (Figure 4). • Photosynthesis increased through spring 2011 and decreased starting in September at the impacted locations and October at the control location (Figure 4). Conclusion The application of our HB model, which accounted for uncertainties from different sources at different spatial and temporal scales in a coherent framework, facilitated a better understanding of oil impacts to S. alterniflora and generated inference we could not have obtained from the empirical data alone. Study area Figure 4 Plots of medians with 95% confidence intervals for the measured photosynthesis rate (μmol C m-2 s-1 – y axis) at different photosynthetic active radiation (PAR) (x-axis) at the locations of A) Control, B) Medium impact, and C) Heavy impact in each month from July 2010 to November 2011. At the x-axis, 1, 2, 3, 4, 5 represent the PAR around 400, 800, 1200, 1600, and 2000 μmol C m-2s-1respectively. Figure 1. (A) Marsh Point (MP)’s general location at the southern border of Davis Bayou, MS (30.375°N, 88.790°W). The inset shows the location of MP relative to the DWH and early oil slick. (B) The three locations we sampled at the MP: control (CO), medium oiled (MO), and heavily oiled (HO) with photos of the vegetation status on July 2010, 13 days after the first oiling. Acknowledgement: The project was funded by National Science Foundation RAPID program (award number: DEB-1048342) and Northern Gulf Institute Phase I BP Oil Spill Research (Task order # 191001-306811-04/TO 001). We would like to acknowledge the Parasitology Laboratory (in particular: Dr. S Curran, and E. Pulis), and the Fishery Center for boat time. We want to thank L. Fu, J. Frey, and H. Huang for helping collect field data, and Drs. S. LaDeau and K. Naithani for insightful discussion. • References: The poster is mainly based on Wu W, Biber P D, Peterson M S and Gong C 2012. Environ. Res. Lett. 7 045302. Other references cited:1) Biber P D, Wu W, Peterson M S, Liu Z and Pham L accepted with minor revision ed B Alford, M S Peterson Impacts of Oil Spill Disasters on Marine Habitats and Fisheries in North America (Boca Raton, FL: CRC Press) 2) Clark J S and LaDeau S L ed 2006 ed J S Clark and A GelfandHierarchical Models of the Environment (New York: Oxford University Press) pp 41-58. 3) Engle V D 2011 Wetlands 31 179-93. 4) McMahon S M and Diez J M 2007 Ecol. Lett. 10 437-52. 5) Pezeshki S R, DeLaune R D and Jugsujinda A 2001 Environ. Pollut. 112 483-89. 6) Pezeshki S R, Hester M W, Lin Q and Nyman J A 2000 Environ. Pollut. 108 129-39. 7) Roth A M F and Baltz D M 2009 Estuar. Coast. 32 565-72.


