MODULE 14. “Life Cycle Assessment (LCA)”
1.42k likes | 1.8k Views
MODULE 14. “Life Cycle Assessment (LCA)” 4 steps of LCA, approaches, software, databases, subjectivity, sensitivity analysis, application to a classic example. . Tier II Case Study Application of Life Cycle Assessment. Statement of intent. What is the purpose of this module?

MODULE 14. “Life Cycle Assessment (LCA)”
E N D
Presentation Transcript
MODULE 14. “Life Cycle Assessment (LCA)” 4 steps of LCA, approaches, software, databases, subjectivity, sensitivity analysis, application to a classic example.
Tier IICase Study Application of Life Cycle Assessment Module 14 – Life Cycle Assessment
Statement of intent What is the purpose of this module? Case Study Application of Life Cycle Assessment. Demonstrates the application of LCA to a Pulp & Paper case study including the interpretation stage. Module 14 – Life Cycle Assessment
References • Finkbeiner M., Wiedemann M., Saur K.; A Comprehensive Approach Towards Product and Organisation Related Environmental Management Tools. Life Cycle Assessment (ISO 14040) and Environmental Management Systems (ISO 14001). PE Product Engineering GmbH, Kirchheimer Str., Dettingen/ Teck, Germany. • HUIJBREGTS M (1998a): “Application of Uncertainty and Variability in LCA. Part I: A General Framework for the Analysis of Uncertainty and Variability in Life Cycle Assessment”. Int J LCA 3:5, 273-280 • HUIJBREGTS M (1998b): “Application of Uncertainty and Variability in LCA. Part II: Dealing with Parameter Uncertainty and Uncertainty due to Choices in Life Cycle Assessment”. Int J LCA 3:6, 343-351 • Maurice B. et al; Uncertainty Analysis in Life Cycle Inventory. “Application to the Production of Electricity with French Coal Power Plants”; J. Cleaner Prod 8 95- 108 (2000) • Salazar E. Munnoch K. Samson R. Stuart P. “Assessment of opportunities for environmental impact reduction from newsprint production using Life Cycle Assessment (LCA)”, Tappi journal • Salazar E. Munnoch K. Samson R. Stuart P. “Development of a LCA Baseline Model for Newsprint Production”, Int J LCA Module 14 – Life Cycle Assessment
References • http://www.epa.sa.gov.au/tools.html#ems • http://www.epa.gov/ems/info/index.htm. • http://ohioline.osu.edu/cd-fact/0188.html • http://www.ag.ohio-state.edu/~rer/rerhtml/rer_65.html Module 14 – Life Cycle Assessment
Tier II: Outline • Case study example of the application of the LCA at an integrated newsprint mill including: • Description of the System Studied • Goal and Scope definition • Life Cycle Inventory (LCI) • Life Cycle Impact Assessment (LCIA) • Model Interpretation including Parameter Sensitivity Analysis • “Classical” model application to identify opportunities for environmental improvements. • Insight into how this model might be used for “Life Cycle Thinking”: • In EMS to demonstrate continuous environmental improvement. • In EIS to quantify and communicate environmental impacts • Multiple choice questions Module 14 – Life Cycle Assessment
Tier II: Outline • Case study example of the application of the LCA at an integrated newsprint mill including: • Description of the System Studied Module 14 – Life Cycle Assessment
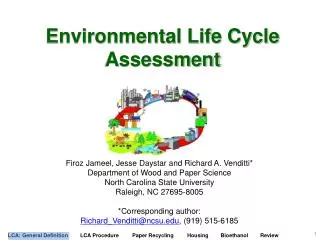
Integrated Newsprint Mill1.1. Description of the System StudiedIntroduction Life Cycle Thinking is being promoted among different sectors involved on product chains. This concept implies that the impacts of all life cycle stages are comprehensively considered when taking informed decisions on production and consumption patterns, policies and management strategies. One of the most effective way to apply the Life Cycle Thinking concept in the pulp and paper industry is by using LCA in the assessment of process variants. Module 14 – Life Cycle Assessment
Integrated Newsprint Mill1.1. Description of the System StudiedDescription of the Study Standard newsprint production at a TMP/DIP integrated mill is the system under study. The main production chain (i.e. woodlands, sawmill and newsprint mill) is located in Northern Ontario and managed by the same company. Production of woodlands includes (in volume): 75% spruce and 25% aspen. During winter spruce logs are transported to the integrated mill by trucks, while aspen is sold to plywood; therefore this is not included as part of the system. Lumber is produced from spruce logs in the on-site sawmill and is sold for the construction industry; this product is also excluded from the system. The on-site sawmill provides around 70% of the chips loaded to TMP and 55% of the hogfuel burnt at the boiler house. Additional chips and hog fuel required to cover the mill needs are purchased from local area sawmills and transported by truck to the integrated mill. Module 14 – Life Cycle Assessment
Integrated Newsprint Mill1.1. Description of the System Studied TMP yield is around 95%. Refining consumes 70% of the total electricity at the mill, but part of this energy is recovered as steam, which constitutes 20% of the total amount of steam consumed at the mill. The secondary fiber furnished to the DIP process includes Old Newspaper (ONP) and Coated Groundwood Specialty (CGS); they are purchased mainly from Ontario and USA and transported to the mill by truck or rail. The yield of the DIP by Dissolved Air Floatation process is around 85%. TMP and DIP pulps are furnished to four paper machines in a ratio of 4 to 1, respectively to produce standard newsprint. This newsprint is distributed to Ontario, Quebec and US cities by truck and rail. Module 14 – Life Cycle Assessment
Integrated Newsprint Mill1.1. Description of the System Studied The steam required for the process is produced on-site from the following energy sources: hog fuel (44%), natural gas (48%) and sludges (8%). Most of the steam is consumed by the paper machines (70% of the total process steam). The effluents of the integrated mill receive primary and a secondary treatment, the sludges produced in the effluent treatment plant are combined with those from DIP and then dewatered, 50% of the sludge is burnt in the boiler house and the rest is landfilled on-site. Almost all the electricity consumed at the integrated mill (around 98%) is purchased from the grid, where the at-source power mix is the following: 33% fossil (coal), 39% nuclear and 28% hydro. Module 14 – Life Cycle Assessment
Tier II: Outline • Case study example of the application of the LCA at an integrated newsprint mill including: • Description of the System Studied • Goal and Scope definition Module 14 – Life Cycle Assessment
Integrated Newsprint Mill1.2. Goal and Scope definition Principles and Framework (ISO 14040) • Objectives of study • Functional unit • System boundaries • Included and • excluded unit • processes • Data categories • By-products • Allocation • Data Quality • Requirements Goal and scope Definition (ISO 14041) Life Cycle Interpretation (ISO 14043) Inventory Assessment (ISO 14041) Impact Assessment (ISO 14042) Module 14 – Life Cycle Assessment
Integrated Newsprint Mill1.2. Goal and Scope definition The objective of the study is to build a baseline model that can be used to demonstrate continuous environmental improvement and to assess future major process modifications. The functional unit was defined as the production an distribution of 1 ton of newsprint with 10% moisture content (air dried metric ton: admt); the system boundaries include the production chain from wood extraction to newsprint distribution (cradle-to-gate). The next figure depicts the system boundaries. Module 14 – Life Cycle Assessment
Integrated Newsprint Mill1.2. Goal and Scope definition Cradle-to-Gate Life Cycle Newsprint Production Module 14 – Life Cycle Assessment
Integrated Newsprint Mill1.2. Goal and Scope definition Transportation of waste paper from warehouses and its disposition in municipal landfills as the alternative of recycling at the mill were modeled in order to assess potential changes on the DIP content of the newsprint. Raw materials (i.e. logs, chips, hogfuel and waste paper) transportation is included. Wastepaper transportation from curbside to material recovery facilities as well as chemicals transportation to the newsprint mill are excluded since they are negligible in comparison with the raw material transportation (Terrachoice 1997). Newspaper printing, use and disposal are excluded because it is assumed that process variants do not significantly affect the environmental impacts of these stages. For instance, the increase of recycled content of the newsprint affects the printability and appearance properties of newspapers in pressrooms and consequently more ink is required (Smook 1992). However this effects are negligible compared with others involved in this kind of modification (e.g. more wastepaper transportation, less electricity consumption, less wastepaper to landfill, etc). Module 14 – Life Cycle Assessment
Integrated Newsprint Mill1.2. Goal and Scope definition • Manufacturing, maintenance and disassembly of assets are not included in the system boundaries since these are used for a large number of functional units during their life cycles and their impact for one functional unit is negligible. • Data categories used on the study: • By type: measured, calculated, estimated • By source: primary (from the studied site/company) and secondary (from commercial databases) According to ISO, for process with outputs that can be partially co-products and partially wastes, the environmental burdens can be allocated only to the co-products (ISO 1999). In this case study, the environmental burdens are allocated among lumber, chips and hog fuel because newsprint production depends on the latter two outflows to cover their fiber and energy requirements, respectively, and otherwise they would be substituted by other virgin materials. Nonetheless, the effect of alternative allocation approaches on the results is assessed in the interpretation phase. Module 14 – Life Cycle Assessment
Integrated Newsprint Mill1.2. Goal and Scope definition • Data Sources and Data Quality Requirements • For the inventory analysis, its used primary data for the processes with major contributions (i.e. integrated mill, electricity production) and secondary data for the background systems with less contribution (i.e. fuel and chemical production, industrial landfill) and we modeled the system in the LCA software SIMAPRO 5.1. • Chemicals and fuels production as ell as landfill are modeled using commercial databases. The following data quality requirements were initially set: • Time : The year of inventory collection is 2001. Data from five years before is desirable. • Geography : The system under study is located in Northern Ontario. North American data is desirable. • Technology : Average technology is desirable. Module 14 – Life Cycle Assessment
Integrated Newsprint Mill1.2. Goal and Scope definition However, only for fuels production the available databases matched with these criteria (i.e. Franklin database: American average 1995-1999). For chemicals production, European databases are used (i.e. IVAM and BUWAL: European averages 1990-1994; KCLECO: Finnish averages 1992). In the case of chemicals for which no specific databases were available (e.g. chelan, coagulants, flocculants and polymers), general databases (e.g. chemicals organic ETH: European averages 1990-1994) are used instead. Landfill models are as well based on a European database (i.e. KCLECO). The effect of the gaps between the initial data quality requirements and the quality of data actually used on the base line model is assessed on the interpretation phase. Module 14 – Life Cycle Assessment
Tier II: Outline • Case study example of the application of the LCA at an integrated newsprint mill including: • Description of the System Studied • Goal and Scope definition • Life Cycle Inventory (LCI) Module 14 – Life Cycle Assessment
Integrated Newsprint Mill1.3. Life Cycle Inventory (LCI) Principles and Framework (ISO 14040) • Primary data for • newsprint and • electricity production • Secondary data for • fuels and chemicals • production • Modeled on SIMAPRO • Aggregated inventory • per 1 admt Goal and scope Definition (ISO 14041) Life Cycle Interpretation (ISO 14043) Inventory Assessment (ISO 14041) Impact Assessment (ISO 14042) Module 14 – Life Cycle Assessment
Integrated Newsprint Mill1.3. Life Cycle Inventory (LCI) The inventory results per 1 admt of newsprint, includes hundreds of substances, from which the most important in terms of mass are presented and discussed in this section. In order to have a better visualization, we have grouped the inventory substances and present the results in graphs, showing the contribution of different system processes to the total amount of substance emitted. Note that in some cases, the scales have been modified in order to show all the substances of a group in the same graph. Module 14 – Life Cycle Assessment
Integrated Newsprint Mill1.3. Life Cycle Inventory (LCI) Sawmill Model Around 30% chips and 40% hogfuel consumed by the newsprint mill is supplied by local sawmills, having independent supply systems (i.e. chips and hogfuel usually are not supplied by the same sawmill). In this study, on-site sawmill model is considered as an average for the production of the total amount of chips and hogfuel required per 1 admt of newsprint. In fact, electricity and steam consumptions are similar between involved sawmills, the only difference can be the energy sources, especially for steam because the fuel breakdown in the newsprint mill boiler house might not be representative for all the local sawmills. However, this difference can be considered negligible if we take into account that steam consumption from sawmill is only 5% of the total system consumption. Module 14 – Life Cycle Assessment
Integrated Newsprint Mill1.3. Life Cycle Inventory (LCI) Transportation Models Round trip is considered for logs transportation and fuel consumption is based on primary data. One-way trip is considered for chips, hogfuel and wastepaper supply as ell as for newsprint distribution; return is not included because usually cargo from other companies or systems is transported in the round way. Fuel consumption is based on mass transported (t or number of loads) and average distances, using fuel efficiency factors (L/km or L/t-km) for truck and locomotive recommended in EPDS guidelines (Terrachoice 1997). Air emissions are calculated based on fuel consumption using emissions factors from the references recommended by EPDS guidelines (Terrachoice 1997); and from Franklin database, sourced on USEPA AP-42 MOBILE model, in the case of particles. Module 14 – Life Cycle Assessment
Integrated Newsprint Mill1.3. Life Cycle Inventory (LCI) CO2 Emissions from Biomass Combustion There is debate among life cycle practitioners about whether or not include CO2 emissions from biomass combustion in the inventory analysis, especially when comparing two alternative energy sources (Reijnders et al. 2003). In this case study, it was applied the natural approach recommended by the International Council of Forest and Paper Association which is compatible which most internationals protocols, including that of the IPPC. This approach is based on the assumption that CO2 emitted from biomass combustion is the atmospheric CO2 that was sequestered during growth of the tree; hence, there is no net contribution to the atmospheric CO2 level (NCASI 2001). Module 14 – Life Cycle Assessment
Integrated Newsprint Mill1.3. Life Cycle Inventory (LCI) Air Emissions The following figures present the inventory results for Green House Gases (GHG), gases and particulates, respectively. For all the air emissions, the contribution from chemical production is negligible compared with the other processes (<5%), therefore it is not shown in the graphs. From the next figure: CO2 is emitted in much higher amounts than methane and N2O. Most of the CO2 (i.e. 79%) is emitted from electricity production; note however that data of GHG emission from electricity production was collected already as CO2 eq. For methane and N2O, the mill direct emissions present more important contributions: 88% of methane is emitted from industrial landfill and 55% of N2O from biomass combustion at the boiler house. Module 14 – Life Cycle Assessment
Integrated Newsprint Mill1.3. Life Cycle Inventory (LCI) GHG emissions per 1 admt of newsprint Module 14 – Life Cycle Assessment
Integrated Newsprint Mill1.3. Life Cycle Inventory (LCI) The next figure shows that there is less variability on the amount of gases emitted compared to the GHG results. SO2 is the gas emitted in the highest amount, mainly from electricity production (57%) and fuels production (38%). CO and NOX are emitted almost in equal amounts; their main contributors are biomass combustion (43% on CO) and electricity production (45% on NOX). VOC is emitted in the least amount, mainly from fuel production (69%). Module 14 – Life Cycle Assessment
Integrated Newsprint Mill1.3. Life Cycle Inventory (LCI) Gas emissions per 1 admt pf newsprint Module 14 – Life Cycle Assessment
Integrated Newsprint Mill1.3. Life Cycle Inventory (LCI) The next figure shows the emissions of particulates according to their size. The contribution of electricity is the most important for TSP (60%) and PM10 (52%); however for PM2.5, which are the particles of major concern, the contribution from transportation becomes more important (45%) than that from electricity production (32%). The combustion of biomass to at boiler house is the third most important contributor with around 10% on TSP and PM10; and 16% on PM2.5. Module 14 – Life Cycle Assessment
Integrated Newsprint Mill1.3. Life Cycle Inventory (LCI) Particulate emissions per 1 admt Module 14 – Life Cycle Assessment
Integrated Newsprint Mill1.3. Life Cycle Inventory (LCI) Water Emissions The following figures shows water emissions respectively: solids, organic load, nutrient and metals. From the next figure: The major contributions for suspended solids are from the newsprint mill (65%) and, in less extent, from electricity production (33%); contributions from chemicals and fuels production are negligible. On the other hand, fuel production has a significant contribution on dissolved solid result (93%). Module 14 – Life Cycle Assessment
Integrated Newsprint Mill1.3. Life Cycle Inventory (LCI) Solid emissions to water per 1 admt of newsprint Module 14 – Life Cycle Assessment
Integrated Newsprint Mill1.3. Life Cycle Inventory (LCI) The next figure shows the results for two organic load indicators: BOD5 and COD. Around 99% of the organic load (for both indicators) comes from newsprint mill. Indirect emissions are shown separately for a better visualization and it is observed that among the indirect emitters, fuels production has the highest contribution. Module 14 – Life Cycle Assessment
Integrated Newsprint Mill1.3. Life Cycle Inventory (LCI) Organic load to water per 1 admt of newsprint Module 14 – Life Cycle Assessment
Integrated Newsprint Mill1.3. Life Cycle Inventory (LCI) The next figure shows the nutrient load in two indicators: N-t and P-t. Like in the case of organic load, the major contribution comes from newsprint production: 99% on N-t and 93% on P-t. The second major contributor to P-t emissions is electricity production with 7%. Module 14 – Life Cycle Assessment
Integrated Newsprint Mill1.3. Life Cycle Inventory (LCI) Nutrient load to water per 1 admt of newsprint Module 14 – Life Cycle Assessment
Integrated Newsprint Mill1.3. Life Cycle Inventory (LCI) The next figure shows the most significant metals en terms of mass (i.e. >1 g/admt). Only for Zn and Mn which are natural wood constituents, newsprint production presents the highest contribution (around 98%); while for the rest of the metals, the major contributor is the chemicals production. Module 14 – Life Cycle Assessment
Integrated Newsprint Mill1.3. Life Cycle Inventory (LCI) Metal emissions to water per 1 admt of newsprint Module 14 – Life Cycle Assessment
Tier II: Outline • Case study example of the application of the LCA at an integrated newsprint mill including: • Description of the System Studied • Goal and Scope definition • Life Cycle Inventory (LCI) • Life Cycle Impact Assessment (LCIA) Module 14 – Life Cycle Assessment
Integrated Newsprint Mill1.4. Life Cycle Impact Assessment (LCIA) Principles and Framework (ISO 14040) • Linear modeling • Site and time generic • Global, regional and • (global) “local” impacts • Tool for the reduction • and assessment of • chemical and other • environmental impacts • (TRACI) • Results aggregated • per impact category • Optional elements • discussed Goal and scope Definition (ISO 14041) Life Cycle Interpretation (ISO 14043) Inventory Assessment (ISO 14041) Impact Assessment (ISO 14042) Module 14 – Life Cycle Assessment
Integrated Newsprint Mill1.4. Life Cycle Impact Assessment (LCIA) Main Assumptions and Simplifications For this study, the output related impact categories proposed by SETAC have been included. Most of the category indicators have been chosen at midpoint, except for human health particles which is assessed at endpoint level. TRACI is used for the assessment after verifying that meets the ISO requirements and SETAC recommendations. Module 14 – Life Cycle Assessment
Integrated Newsprint Mill1.4. Life Cycle Impact Assessment (LCIA) Selection of Impact Categories, Category Indicators and Characterization Models Selection of impact categories, category indicators and characterization models was performed according to the objectives and context of the study and based on SETAC best available practices which are ISO compatibles (Udo de Haes et al. 1999a). The next table summarizes the results of this process. Input related impact categories (i.e. abiotic resources and land use) are not included on the study mainly because best available methods have not been yet identified (Udo de Haes et al. 2002). Furthermore, the impact of biotic resources is not relevant to this study since the wood resource in the system (i.e. spruce) is from man-controlled cultures and therefore is not depleted (Udo de Haes et al. 2002). Module 14 – Life Cycle Assessment
Integrated Newsprint Mill1.4. Life Cycle Impact Assessment (LCIA) Module 14 – Life Cycle Assessment
Integrated Newsprint Mill1.4. Life Cycle Impact Assessment (LCIA) In the case of land use, available methods were reviewed (Weidema 2001, Lindeijer et al 2002), however the lack of the specific data for the activities related with the system studied was a constraint to characterize this impact. Nonetheless, inventory data is included in the base line model in order to analyze results at inventory level and incorporate the appropriate models when they are available. All the output related impact categories recommended by SETAC are included (Udo de Haes et al. 1999b). Global impacts are modeled at midpoint level using the International Panel on Climate Change (IPCC, time horizon: 100y) and World Meteorological Organization (WMO, time horizon: infinite) characterization factors for global warming and ozone depletion, respectively. Module 14 – Life Cycle Assessment
Integrated Newsprint Mill1.4. Life Cycle Impact Assessment (LCIA) Regional impacts are modeled at midpoint using the Toll for the Reduction and Assessment of Chemicals and Other Environmental Impacts (TRACI) method from the United States Environmental Protection Agency. This method was selected because it includes spatial differentiation in fate and sensitivity recommended by SETAC (Udo de Haes et al. 1999b) and because it has been demonstrated the potentially important influence of release location upon the strength of expected impact (Norris 2003, Hauschild et al. 2003). Module 14 – Life Cycle Assessment
Integrated Newsprint Mill1.4. Life Cycle Impact Assessment (LCIA) For local impacts, Traci models were also selected. Ecotoxicity, human health cancer and human health non cancer are modeled at midpoint level using multimedia fate modeling for US average conditions while human health particles is modeled at endpoint level and characterization factors are available per state (Bare et al. 2003). Michigan was selected as reference state in the latter case. Compatibility with SETAC recommendations were as well identified for these impacts including the use of midpoint toxicity indicators for species composition for terrestrial and aquatic ecosystems and the division of human health impacts in disability-type subcategories (Udo de Haes et al. 1999b). Module 14 – Life Cycle Assessment
Integrated Newsprint Mill1.4. Life Cycle Impact Assessment (LCIA) The next table shows the impact assessment results for the impact categories. As a consequence of the impact assessment, we have reduced the hundreds of inventory indicators in 9 impact category indicators which allow a better analysis of the environmental performance of the system studied. Module 14 – Life Cycle Assessment
Integrated Newsprint Mill1.4. Life Cycle Impact Assessment (LCIA) • Particle Size Distribution • The following assumptions and models were applied in order to calculate the particulates size distribution for these processes: • Natural gas pre-combustion and combustion: Particulates emitted from natural gas combustion are smaller than 1 micrometer (USEPA 1998). In the natural gas production process, particulates are emitted from compressor engines that fire natural gas (USEPA 1995a); therefore, the same particulates size distribution is used. • Diesel pre-combustion: Size distribution for industrial boilers firing residual oil (USEPA 1995b) was included on the model. Actually, in the diesel production process there is also particulates emission from the cracking processes; however, due to lack of information about the size distribution of this operation, distribution for industrial boilers is considered as representative for the whole process. Module 14 – Life Cycle Assessment
Integrated Newsprint Mill1.4. Life Cycle Impact Assessment (LCIA) • Transportation road/rail: Size distribution for diesel vehicles (USEPA 2003) was included on the model. Emission data from processes with small contribution on the particulate inventory per 1 admt of newsprint were not refined by including size distribution (i.e. chemicals production as well as gasoline, propane and kerosene combustion and pre-combustion). Module 14 – Life Cycle Assessment