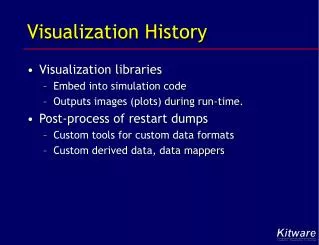
Lecture 14: Scientific Visualization Information Visualization CPSC 533C, Fall 2006
Lecture 14: Scientific Visualization Information Visualization CPSC 533C, Fall 2006 Tamara Munzner UBC Computer Science 26 Oct 2006 Credits almost unchanged from lecture by Melanie Tory (University of Victoria) who in turn used resources from Torsten Möller (Simon Fraser University)


Lecture 14: Scientific Visualization Information Visualization CPSC 533C, Fall 2006
E N D
Presentation Transcript
Lecture 14: Scientific VisualizationInformation VisualizationCPSC 533C, Fall 2006 Tamara Munzner UBC Computer Science 26 Oct 2006
Credits • almost unchanged from lecture by Melanie Tory (University of Victoria) • who in turn used resources from • Torsten Möller (Simon Fraser University) • Raghu Machiraju (Ohio State University) • Klaus Mueller (SUNY Stony Brook)
News • Reminder: no class next week • I'm at InfoVis/Vis in Baltimore
Overview • What is SciVis? • Data & Applications • Iso-surfaces • Direct Volume Rendering • Vector Visualization • Challenges
SciVis InfoVis Difference between SciVis and InfoVis Parallel Coordinates Direct Volume Rendering [Hauser et al.,Vis 2000] [Fua et al., Vis 1999] Isosurfaces Glyphs Scatter Plots Line Integral Convolution [http://www.axon.com/gn_Acuity.html] Node-link Diagrams [Cabral & Leedom,SIGGRAPH 1993] Streamlines [Lamping et al., CHI 1995] [Verma et al.,Vis 2000]
Difference between SciVis and InfoVis • Card, Mackinlay, & Shneiderman: • SciVis: Scientific, physically based • InfoVis: Abstract • Munzner: • SciVis: Spatial layout given • InfoVis: Spatial layout chosen • Tory & Möller: • SciVis: Spatial layout given + Continuous • InfoVis: Spatial layout chosen + Discrete • Everything else -- ?
Overview • What is SciVis? • Data & Applications • Iso-surfaces • Direct Volume Rendering • Vector Visualization • Challenges
Medical Scanning • MRI, CT, SPECT, PET, ultrasound
Medical Scanning - Applications • Medical education for anatomy, surgery, etc. • Illustration of medical procedures to the patient
Medical Scanning - Applications • Surgical simulation for treatment planning • Tele-medicine • Inter-operative visualization in brain surgery, biopsies, etc.
Biological Scanning • Scanners: Biological scanners, electronic microscopes, confocal microscopes • Apps – physiology, paleontology, microscopic analysis…
Industrial Scanning • Planning (e.g., log scanning) • Quality control • Security (e.g. airport scanners)
Scientific Computation - Domain • Mathematical analysis • ODE/PDE (ordinary and partialdifferential equations) • Finite element analysis (FE) • Supercomputer simulations
Scientific Computation - Apps • Flow Visualization
Overview • What is SciVis? • Data & Applications • Iso-surfaces • Direct Volume Rendering • Vector Visualization • Challenges
Isosurfaces - Examples Isolines Isosurfaces
Isosurface Extraction 0 1 1 3 2 • by contouring • closed contours • continuous • determined by iso-value • several methods • marching cubes is most common 1 3 6 6 3 3 7 9 7 3 2 7 8 6 2 1 2 3 4 3 Iso-value = 5
MC 1: Create a Cube • Consider a Cube defined by eight data values: (i,j+1,k+1) (i+1,j+1,k+1) (i,j,k+1) (i+1,j,k+1) (i,j+1,k) (i+1,j+1,k) (i,j,k) (i+1,j,k)
MC 2: Classify Each Voxel • Classify each voxel according to whether it liesoutside the surface (value > iso-surface value)inside the surface (value <= iso-surface value) 10 10 Iso=9 5 5 10 8 Iso=7 8 8 =inside =outside
MC 3: Build An Index • Use the binary labeling of each voxel to create an index v8 v7 11110100 inside =1 v4 outside=0 v3 v5 v6 00110000 v1 v2 Index: v3 v5 v6 v1 v2 v4 v7 v8
MC 4: Lookup Edge List • For a given index, access an array storing a list of edges • all 256 cases can be derived from 15 base cases
MC 4: Example • Index = 00000001 • triangle 1 = a, b, c c a b
MC 5: Interp. Triangle Vertex • For each triangle edge, find the vertex location along the edge using linear interpolation of the voxel values i+1 i x =10 =0 T=8 T=5
MC 6: Compute Normals • Calculate the normal at each cube vertex • Use linear interpolation to compute the polygon vertex normal
Overview • What is SciVis? • Data & Applications • Iso-surfaces • Direct Volume Rendering • Vector Visualization • Challenges
Rendering Pipeline (RP) Classify
Classification • original data set has application specific values (temperature, velocity, proton density, etc.) • assign these to color/opacity values to make sense of data • achieved through transfer functions
a(f) RGB(f) Shading, Compositing… Human Tooth CT Transfer Functions (TF’s) RGB a • Simple (usual) case: Map data value f to color and opacity f Gordon Kindlmann
TF’s • Setting transfer functions is difficult, unintuitive, and slow a a f f a a f f Gordon Kindlmann
Transfer Function Challenges • Better interfaces: • Make space of TFs less confusing • Remove excess “flexibility” • Provide guidance • Automatic / semi-automatic transfer function generation • Typically highlight boundaries Gordon Kindlmann
Rendering Pipeline (RP) Classify Shade
Light Effects • Usually only considering reflected part Light reflected specular Light absorbed ambient diffuse transmitted Light=refl.+absorbed+trans. Light=ambient+diffuse+specular
Rendering Pipeline (RP) Classify Shade Interpolate
1D • Given: • Needed: • Needed: Interpolation • Given: 2D
Interpolation • Very important; regardless of algorithm • Expensive => done very often for one image • Requirements for good reconstruction • performance • stability of the numerical algorithm • accuracy Linear Nearest neighbor
Rendering Pipeline (RP) Classify Shade Interpolate Composite
Ray Traversal Schemes Intensity Max Average Accumulate First Depth
Ray Traversal - First • First: extracts iso-surfaces (again!)done by Tuy&Tuy ’84 Intensity First Depth
Ray Traversal - Average • Average: produces basically an X-ray picture Intensity Average Depth
Ray Traversal - MIP • Max: Maximum Intensity Projectionused for Magnetic Resonance Angiogram Intensity Max Depth
Ray Traversal - Accumulate • Accumulate: make transparent layers visible!Levoy ‘88 Intensity Accumulate Depth
1.0 Volumetric Ray Integration color opacity object (color, opacity)
Overview • What is SciVis? • Data & Applications • Iso-surfaces • Direct Volume Rendering • Vector Visualization • Challenges
Flow Visualization • Traditionally – Experimental Flow Vis • Now – Computational Simulation • Typical Applications: • Study physics of fluid flow • Design aerodynamic objects
Techniques Glyphs (arrows) Contours Jean M. Favre Streamlines
Techniques - Stream-ribbon • Trace one streamline and a constant size vector with it • Allows you to see places where flow twists