DIE CASTING PROCESS OPTIMIZATION OF -MPI MANIFOLD USING TAGUCHI METHOD
490 likes | 903 Views
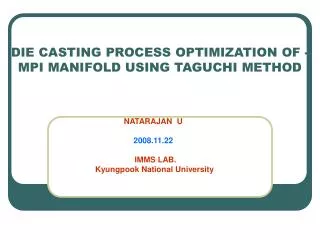
DIE CASTING PROCESS OPTIMIZATION OF -MPI MANIFOLD USING TAGUCHI METHOD. NATARAJAN U 2008.11.22 IMMS LAB. Kyungpook National University. CONTENTS. Introduction Objectives of this work Die casting process of Al Alloy. Process optimization using Taguchi methods

DIE CASTING PROCESS OPTIMIZATION OF -MPI MANIFOLD USING TAGUCHI METHOD
E N D
Presentation Transcript
DIE CASTING PROCESS OPTIMIZATION OF -MPI MANIFOLD USING TAGUCHI METHOD NATARAJAN U 2008.11.22 IMMS LAB. Kyungpook National University
CONTENTS • Introduction • Objectives of this work • Die casting process of Al Alloy. • Process optimization using Taguchi methods • ANOVA to interpret Taguchi experiments • Process Capability study • Results • Proposed work
INTRODUCTION • TAGUCHI’S DOE is a statistical method for optimizing any process. • This work reports the basis of optimizing the DIE CASTING process. • The material used to form an automobile MANIFOLD is Aluminium alloy.
OBJECTIVES OF THIS WORK • To satisfy the customer requirements. • To reduce the rejection rate. • To increase the productivity.
Steps in TAGUCHI’S DOE • Selecting significant process parameters. • Selection of OA (Orthogonal Array) • Levels for process parameters. • Experimental analysis. • Results.
QUALITY CHARACTERISTIC(OUTPUT) • Casting density is the quality characteristic ( output ) • Casting density relates to porosity, shrinkage, micro voids etc.
SELECTED PROCESS PARAMETERS • Metal temperature in ˚c Range :720 to 760. • Die pre-heat temperature in ˚c Range : 200 to 215. • Setting time in sec Range : 95 to 115.
LEVELS OF PROCESS PARAMETERS • Parameter A 1) 720 2) 740 3) 760. • Parameter B 1) 200 2) 207 3) 215. • Parameter C 1) 95 2)105 3)115.
CONSTANT PARAMETERS • Job : Automobile Manifold • Material : Aluminium alloy • Composition : Al + Mg(0-0.5%) +Cu(2.0-4.0%) + Si(7.0-10.0%) +Mn(0-0.5%)
INTERACTIONS • AXB • BXC • AXC
DEGREES OF FREEDOM (DOF) For 3 parameters each at three levels:[ 2+2+2] For three interactions:[ 4 + 4 + 4] Required DOF=18 [2+2+2+4+4+4)] .
ORTHOGONAL ARRAY SELECTION The number of DOF for OA should be greater than or equal to the number of DOF required Hence, L27 OA hasbeen selected
S/N RATIO • S/N ratio (db) = -10 log [ 1/n∑ ni=1 (1/Di2)] ( FOR HIGHER-THE-BETTER TYPE ) where Di is the response value for a trial condition repeated n times.
Optimal points • Metal temperature : A3 • Die pre-heat temperature : B3 • Setting time : C1
PREDICTED CAST DENSITY AT THE OPTIMAL CONDITION Predicted Optimum (U) = T’ + ( A3’ - T’ ) + (B3’ - T’ ) + (C1’ - T’ ) Where T’ is the Overall mean of all the observations in data and , A3’ , B3’, C1’ are the mean value of the observations due to the factors A3, B3 and C1 respectively Predicted cast density at the optimal condition = 2.646 g / cc
ESTIMATION OF SUM OF SQUARES (SS) • SST = SSF + SSE • DFT = DFF + DFE where SST = Total sum of squares SSF = Sum of squares due to factors SSE = Sum of squares due to error DFT = Total degree of freedom DFF = Degree of freedom due to factors DFE = Degree of freedom due to error
ESTIMATION OF SUM OF SQUARES (SS) • SST = (2.6352+ 2.6372 + 2.6402 + . . . ……+ 2.6512) - ( T )2/81 SST = 2.64428E-04 • SSA = [(A1-A2)2 + (A2-A3)2 + (A3-A1)2] / nr Where n is the no of experiments in OA and r is the no of replications SSA = 2.9417E-05 Similarly, sum of squares for all the factors are estimated.
PROCESS CAPABILITY STUDY Confidence Interval (CI) = 0.04112 The 95% CI of the predicted optimum is, x-0.04112 < µ < x+0.04112 X=2.648g/cc Upper limit = 2.6522g/cc Lower limit = 2.6438g/cc
Process Capability index(Ppk) [(UCL-X’)/6S or (X’-LCL)/6S] Ppk =1.77
RESULTS 1. Metal temperature (˚C) : 760. 2. Die pre-heat temperature (˚C) : 215. 3. Setting time (sec) : 95 4. Predicted optimum casting density : 2.646 g/cc 5. Process capability index (Ppk) :1.77
PROPOSED WORK Multi-response optimization of parameters in Micro-EDM • INPUT PARAMETERS Peak current ( i) Ignition voltage (v) Pulse on time (ti) Pulse off time (to) • OUTPUT PARAMETERS Metal Removal Rate (MRR) Surface roughness (Ra)
KEY REFERENCES • [1] J. Antony(2001), Process optimization using Taguchi methods of experimental design, Work study, MCB university press:vol.50(2),51-57 • [2] P.J. Ross, Taguchi techniques for Quality Engineering, McGraw-Hill, New York, 1988 • [3] M.S. Padke, Quality Engineering Using Robust Design, Prentice-Hall, Englewood Cliffs.NJ, 1989. • [4] G.S. Peace, Taguchi Methods: A hands-on approach, Addison-Wesley, New York, 1993. • [6] D.C. Montgomery, Design and analysis of experiments, 5th Edition, John Wiley and sons, 2001