Download
1 / 21
210 likes | 400 Views
Automated Detection of Speech Landmarks Using Gaussian Mixture Modeling A. R. Jayan P. C. Pandey {arjayan, pcpandey}@ee.iitb.ac.in EE Dept., IIT Bombay February, 2008.

E N D
Automated Detection of Speech Landmarks Using Gaussian Mixture Modeling A. R. Jayan P. C. Pandey {arjayan, pcpandey}@ee.iitb.ac.in EE Dept., IIT Bombay February, 2008
A. R. Jayan and P. C. Pandey, "Automated detection of speech landmarks using Gaussian Mixture Modeling", Frontiers of Research on Speech and Music (FRSM-08), Feb. 20-21, 2008, Jadavpur University, Kolkata, India. Abstract-Landmarks in speech signal are regions with abrupt spectral variations. Automated detection of these regions is important for several applications in speech processing. Performance of landmark detection using parameters extracted from predefined spectral bands generally gets limited by speaker related spectral variability. This paper presents a landmark detection technique which adapts to the acoustic properties of speech. Parameters are extracted from Gaussian mixture modeling (GMM) of smoothed spectral envelope. A single rate of rise function, obtained from the set of GMM parameters, is used for locating landmark regions. The method was evaluated using manually labeled VCV syllables and sentences. It was possible to detect 85 % of stop release bursts in VCV syllables and 82 % in sentences, with an accuracy of 5 ms, compared to the manually located landmarks. Address: SPI Lab, EE Dept., IIT Bombay, Powai Mumbai 400 076, India Web: http://www.ee.iitb.ac.in/~spilab E-mail: {arjayan, pcpandey}@ee.iitb.ac.in
PRESENTATION OUTLINE • Introduction • Gaussian Mixture Modeling (GMM) • 3. Experimental results • 4. Summary and conclusion
1. INTRODUCTION Landmark detection Speech landmarks Regions containing important information for speech perception Associated with spectral transitions • Landmarks types • 1. Abrupt-consonantal (AC) - Tight constrictions of primary articulators • 2. Abrupt (A) - Fast glottal or velum activity • 3. Non-abrupt (N)- Semi-vowel landmarks, less vocal tract constriction • 4. Vocalic (V) - Vowel landmarks • Abrupt (~68%) Vocalic (~29%) Non-abrupt (~3%)
Example of landmarks Applications of landmark detection Feature extraction for supporting speech recognition Intelligibility enhancement
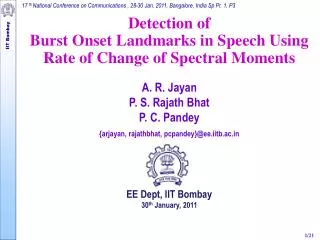
Det. rate (%) Det. time (ms) Earlier studies on automated landmark detection Schutte and Glass, 2005 ▪ Mel frequency cepstral coefficients, support vector machines (SVMs) ▪ Application: Extraction of features for speech recognition Sainath and Hazen, 2006 ▪ Sinusoidal model, short-time energy, signal harmonicity ▪ Application: Extraction of features for speech recognition Liu, 1996 ▪ 512-point DFT on 6 ms frames, frame shift 1 ms ▪ 20 point moving average along time to get smooth parameter tracks ▪ First difference of maximum spectral component in 6 spectral bands ▪ Application: Extraction of features for speech recognition
Factors limiting detection rate and temporal resolution ▪ Effectiveness of parameters in capturing acoustic variations ▪ Short-time energy variation in spectral bands : weak burst may not get detected ▪ Centroid frequency : not well defined during low energy segments ▪ Fixed band boundaries : may not adapt to speech variability ▪ Temporal smoothening of parameter tracks ▪ Time resolution affected ▪ Detection operation ▪ First difference operation not optimized for all types of landmarks ▪ Time-step 10 ms may be too large for burst detection ▪ Effect of noise on parameters ▪ Cepstral features - sensitive to noise ▪ Band energy or spectral peaks - not much affected ▪ Band centroids -sensitive to noise
Need for high temporal resolution and detection rate Application dependent Speech recognition:Analysis performed around landmarks for parameter extraction. Landmarks detected with ▪ high accuracy ▪ moderate temporal resolution (20-30 ms) Intelligibility enhancement:Modification of landmark regions, detected with ▪ good temporal resolution (0-5 ms) ▪ some tolerance to detection errors, but low tolerance to insertions as insertions may introduce distortions Landmark type Short duration events (bursts) need high time resolution. Voicing onsets/offsets may not require high resolution as signal properties remain same for a long duration.
Improvement in intelligibility of conversational speech by incorporating properties of clear speech: • Enhancing landmark regions • Consonant–vowel intensity ratio (CVR) enhancement • Increasing energy of consonant segment. • Consonant duration enhancement • Increasing CV and VC transitions (burst duration, VOT, formant transition). • Challenges • Accurate detection of regions for modification. • Analysis-modification-synthesis with low processing artifacts. • Processing without increasing overall speaking rate, increase in transition regions with a corresponding decrease in steady state segments.
Earlier studies on intelligibility enhancement • Colotte & Laprie, 2000 • Identifying regions based on mel-cepstral analysis • Stops and unvoiced fricatives amplified by +4 dB • Transition segments time-scaled by 1.8, 2.0 (TD-PSOLA) • Skowronski & Harris, 2006 • Spectral transition measure based voiced/unvoiced classification • Energy redistribution in voiced / unvoiced segments (ERVU) • Amplifying low energy regions critical to intelligibility • Jayan & Pandey, 2007 • Variation of maximum energy and centroid in 5 spectral bands • VC and CV transition segments expanded, steady-state segments compressed → less temporal masking by nearby vowel • Intensity scaling of transition segments • Overall speech duration is kept unaltered
Fixed spectral band based landmark detection Spectrum divided into five non-overlapping bands ▪ 0–0.4, 0.4–1.2, 1.2–2.0, 2.0–3.5, 3.5–5.0 kHz ▪ Sampling frequency 10 k samples/s, ▪ 512-point FFT on 6 ms frames ▪ Frame shift: 1 ms. ▪ Peak spectral component and band centroid in each band, every 1 ms (related to formant peaks and formant frequencies) Peak energy Centroid frequency Rate-of-rise functions Transition index
Limitations Only 60 % release bursts in VCV syllables detected within 5 ms of manual labels. Possible reasons ▪ Poor approximation of formant peaks and frequencies by maximum energy and centroid in spectral bands with fixed boundaries. ▪ Temporal smoothening performed on parameter tracks. Gaussian Mixture Modeling (GMM) ▪ Provides parametric representation of smoothened spectra. ▪ Can be used to extract formant like features. ▪ Gaussian mean → formant frequency, amplitude → formant peak, variance → formant bandwidth. ▪ Abrupt spectral variations results in abrupt variations in Gaussian parameters. ▪ Parameter extraction by smoothening in the spectral domain, no smoothening in temporal domain → improved temporal resolution.
Earlier studies on Gaussian modeling of speech spectra ▪ Zolfaghari & Robinson, 1996 ▪ Cepstral smoothened speech spectrum modeled by GMMs. ▪Formant analysis, formant vocoder. ▪ Formant tracks followed LPC based tracker, higher formant bandwidths. ▪ Stuttle & Gales, 2002 ▪ Low pass filtered speech spectrum modeled by GMMs. ▪GMM features used with MFCC features in speech recognition. ▪ GMM parameters found effective in noisy environments. ▪ Omar et al., 2001 ▪ Used Gaussian model of phonetic boundaries. ▪ Improvement in phoneme recognition accuracy. ▪ Lindblom & Samuelsson, 2003 ▪ Bounded support expectation maximization algorithm for modeling speech source spectra (EMBS).
Objective Automated detection of landmarks for stop consonants with high temporal resolution, using Gaussian Mixture Modeling of speech spectra Landmark detection using GMM parameters.
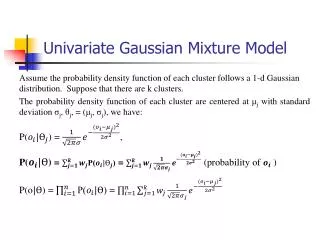
2. GAUSSIAN MIXTURE MODELING ▪ Speech signal sampled at 10 k samples / second ▪ 512 point DFT on 6 ms frames ▪ Frame shift = 1 ms ▪ Spectral smoothening by low pass filtering spectral envelope, filter impulse response → 20 point raised cosine window. ▪ Parameter extraction by expectation maximization (EM) algorithm. GMM approximation of smoothened spectral envelope Initialization ▪ Means → equal spacing along k, ▪ Equal mixture weights = 1/M ▪ Equal standard deviations N/(2M)
Gaussian parameters Gaussian amplitudes consistent during vowel, consonant, and silence segments. Mean and variances, not well defined during low energy segments. Parameter tracks derived using Gaussian amplitudes. Detection of burst landmarks Rate of rise (ROR) function derived using Gaussian amplitudes except that of first Gaussian. Normalized to 0-1 range, 10 point median filtering. Square root operation to make ROR more sensitive to burst onsets.
3. RESULTS AND DISCUSSION Number of Gaussians for modeling decided by computing norm. mean squared error between smoothed spectrum and Gaussian modeled spectrum. e(n) computed for vowels /a/, /i/, /u/, and fricatives /v/, /z/, /f/, /s/. Voiced sounds modeled more accurately. Not much improvement in increasing number of Gaussians above 3. Selected M= 4, for modeling 4 significant vocal tract resonances.
Evaluation using VCV syllables Test material : 3 vowels /a/, /i/, /u/ and 6 stops /b/, /d/, /g/, /p/, /t/, /k/and 6 speakers (3 male, 3 female) → 108 manually labeled tokens. Signal Spectrogram GMM spectrogram Amplitude Mean Variance ROR
Evaluation using sentences Test material : 15 Marathi sentences with 98 manually labeled tokens. 1 speaker 'kamal, ki thi kam kar the ?' Signal Amplitude Mean Variance Burst landmarks ROR
Comparison of results M1 - GMM based, M2- maximum spectral component + centroid in spectral bands with fixed boundaries VCV syllables Sentences Observations M1 outperforms M2 in terms of detection rates for temporal resolution < 10 ms. M2 detects more landmarks than M1, but with lesser temporal resolution.
4. SUMMARY & CONCLUSION Landmark detection using Gaussian parameters investigated: ▪ Good temporal resolution compared to parameters extracted from spectral bands with fixed boundaries. ▪ Most of the landmarks detected within 10 ms of manual labels. Future work: ▪ Evaluation of landmark detection method in presence of noise. ▪ Method is more computation intensive and needs further investigations for real-time detection of landmarks