Download
1 / 66
670 likes | 792 Views
Chem 355 10 Lecture 25/26 Electronic Emission Spectroscopy . a) Excited-State Processes. Jablonsky Diagram. S 1. k ix. D I – rate of absorption . k f – fluorescence . k ic – internal conversion . k ix – intersystem crossing

E N D
Chem 355 10 Lecture 25/26 Electronic Emission Spectroscopy . a) Excited-State Processes
Jablonsky Diagram S1 kix DI – rate of absorption . kf – fluorescence . kic – internal conversion . kix– intersystem crossing knr – internal conversion . kP – phosphorescence T kic DI kf knr kP S0
The efficiency of e.g. fluorescence from S1 can be denoted as: ff , or thefluorescence quantum yield. It represents the fraction of the photons absorbed into the S1 state that reappear in the form of fluorescence. Note: the energy is not involved. Consider that ff = 1.0 for a particular molecule. The energy of the photon that excited the molecule in e.g. a 0 → 1’ appears in a 0’→ 1 transition in the fluorescence. The quantum effiency = but the energy efficiency .
The efficiency of e.g. fluorescence from S1 can be denoted as: ff , or thefluorescence quantum yield. It represents the fraction of the photons absorbed into the S1 state that reappear in the form of fluorescence. Note: the energy is not involved. Consider that ff = 1.0 for a particular molecule. The energy of the photon that excited the molecule in e.g. a 0 → 1’ appears in a 0’→ 1 transition in the fluorescence. The quantum effiency = 1 but the energy efficiency .
A Japlonsky diagram could involve other processes. Photochemistry at either S1 or T can be significant in some systems. A cis-trans conversion in retinal in our eyes is efficient and results in a signal to the brain. But our eyes don’t, on the other hand, fluoresce. In the presence of other molecules a transfer of excitation energy can occur at either the S1 or T excited state from one molecule to the next. In the kinetic description implied with the use of rate constants in the Japlonsky diagram not only due to rate constants contribute to the decay of the excited states, but each of the processes occurring from a particular excited state can be considered to occur with a specific efficiency. a) b)
A Japlonsky diagram could involve other processes. Photochemistry at either S1 or T can be significant in some systems. A cis-trans conversion in retinal in our eyes is efficient and results in a signal to the brain. But our eyes don’t fluoresce, on the other hand,. In the presence of other molecules a transfer of excitation energy can occur at either the S1 or T excited state from one molecule to the next. In the kinetic description implied with the use of rate constants in the Japlonsky diagram not only due to rate constants contribute to the decay of the excited states, but each of the processes occurring from a particular excited state can be considered to occur with a specific efficiency. ivolve a) b)
A Japlonsky diagram could involve other processes. Photochemistry at either S1 or T can be significant in some systems. A cis-trans conversion in retinal in our eyes is efficient and results in a signal to the brain. But our eyes don’t fluoresce, on the other hand,. In the presence of other molecules a transfer of excitation energy can occur at either the S1 or T excited state from one molecule to the next. In the kinetic description implied with the use of rate constants in the Japlonsky diagram not only due to rate constants contribute to the decay of the excited states, but each of the processes occurring from a particular excited state can be considered to occur with a specific efficiency. ivolve a) b)
A Japlonsky diagram could involve other processes. Photochemistry at either S1 or T can be significant in some systems. A cis-trans conversion in retinal in our eyes is efficient and results in a signal to the brain. But our eyes don’t fluoresce, on the other hand,. In the presence of other molecules a transfer of excitation energy can occur at either the S1 or T excited state from one molecule to the next. In the kinetic description implied with the use of rate constants in the Japlonsky diagram not only do these rate constants contribute to the decay of the excited states, but each of the processes occurring from a particular excited state can be considered to occur with a specific efficiency. a) b)
The efficiency of any particular process is given by: e.g. from the Jablonsky diagram displayed here:
The efficiency of any particular process is given by: e.g. from the Jablonsky diagram displayed here: In a 2nd example:
Tryptophan methylester LADH 400 450 500
Tryptophan methylester LADH 400 450 500
Emission spectra are recorded with excitation at a particular wavelength absorbed by the emitting species
Emission spectra are recorded with excitation at a particular wavelength absorbed by the emitting species fixed
Emission spectra are recorded with excitation at a particular wavelength absorbed by the emitting species and then the wavelengths of the emission are scanned fixed
Emission spectra are recorded with excitation at a particular wavelength absorbed by the emitting species and then the wavelengths of the emission are scanned scanned fixed
Emission spectra are recorded with excitation at a particular wavelength absorbed by the emitting species and then the wavelengths of the emission are scanned In most cases, e.g. a single species in solution, the emission spectrum, and its emission quantum efficiency are independent of the wavelength of excitation. scanned fixed
Tryptophan methylester LADH 400 450 500
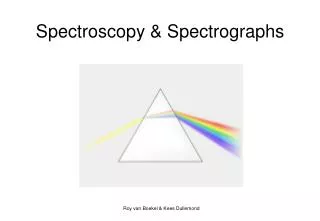
An excitation spectrum involves measuring the intensity F(l) at some particular lemission* as a function of the excitation wavelength (normalized to constant intensity). *In some cases the entire emission band is detected with . appropriate filtering.
Excitation spectra are obtained by monitoring the intensity of the emission at a particular wavelength while scanning the wavelengths of the excitation. fixed scanned
Excitation spectra are obtained by monitoring the intensity of the emission at a particular wavelength while scanning the wavelengths of the excitation. In the simple case of a single species in solution, the excitation spectra, when corrected for variation in excitation intensity, display the profile of the absorption spectra. fixed scanned
If the intensity of the emission in the protein spectrum that is clearly due to tyrosine (e.g. 380 nm) is measured as a function of excitation wavelength, a spectrum that mimics tyrosine absorption is obtained. 380 nm
If the intensity of the emission in the protein spectrum that is clearly due to tyrosine (e.g. 380 nm) is measured as a function of excitation wavelength, a spectrum that mimics tyrosine absorption is obtained. Tyrosinein LADH 380 nm EXCITATION WAVELENGTH (nm)
When excited at ~300 nm, there is longer a tyrosine contribution. It doesn’t absorb. The double peaks still appear in the Trp region of the spectrum. When excited at 305 nm, the sharp “blue” Trp peak is no longer excited*. Tyrosinein LADH 380 nm EXCITATION WAVELENGTH (nm)
*Excitation at 305 nm results in a protein spectra that looks just like of tryptophan-methylester, i.e. with a single sharp 0-0 peak. That peak, however, is now at 412 nm shifted to the red from the 404 nm position in the Trp-derivative or the blue-peak in the protein. EXCITATION WAVELENGTH (nm)
Tryptophan methylester LADH 400 450 500
Alkaline phosphatase, a dimeric enyzme with 3 Trp residues in each subunit in the protein. Trp 109 is buried near the active site.
Alkaline phosphatase, a dimeric enyzme with 3 Trp residues in each subunit in the protein. Trp 109 is buried near the active site.
Alkaline phosphatase, a dimeric enyzme with 3 Trp residues in each subunit in the protein. Trp 109 is buried near the active site. The other 2 are exposed to the mobile polar solvent.
Alkaline phosphatase, a dimeric enyzme with 3 Trp residues in each subunit in the protein. Trp 109 is buried near the active site. The other 2 are exposed to the mobile polar solvent. Trp109 has a phosphorescence lifetime at 298K of 2 sec. The other 2 have are exposed to the mobile solvent and have triplet lifetimes too short to measure (msec.)
The fluorescence intensity of molecules in solution is proportional to the concentration of the emitting molecule. If the absorbance is high at lex in e.g. a 1cm2 cell, a significant fraction of the exciting radiation will be reduced before reaching the center of the cell where the emission is detected. The absorbance at lex should be < 0.05 by using dilute solutions or employing cells with small pathlengths. Retaining lemission fixed, the emission intensity varies with lex and traces out e(l) for the absorption of the emitting species. This is referred to as an excitation spectra. The spectra need to be corrected for variations in the intensity of the exciting radiation.
The fluorescence intensity of molecules in solution is proportional to the concentration of the emitting molecule. If the absorbance is high at lex in e.g. a 1cm2 cell, a significant fraction of the exciting radiation will be reduced before reaching the center of the cell where the emission is detected. The absorbance at lex should be < 0.05 by using dilute solutions or employing cells with small pathlengths. Retaining lemission fixed, the emission intensity varies with lex and traces out e(l) for the absorption of the emitting species. This is referred to as an excitation spectra. The spectra need to be corrected for variations in the intensity of the exciting radiation.
F = ffDI = ff(Io–I) = ff(Io– Io e- ) = ff Io(1–e- ) Since dl<<1.0 cm, then 1-e- = , then F = ffIo(lex) kl(molar absorptivity coeff.) = 2.303el(molar extinction coeff. or . molar absorption coeff.)
F = ffDI = ff(Io–I) = ff(Io– Io e- ) = ff Io(1–e- ) Since dl<<1.0 cm, then 1-e- = , then F = ffIo(lex) kl(molar absorptivity coeff.) = 2.303el(molar extinction coeff. or . molar absorption coeff.)
Asthe absorbance (Alex) of the solution at the exciting wavelength increases, the intensity reaching the center of the cell is attenuated. At high absorbance all of the exciting light is absorbed at the front surface and no emission is observed from the center of the cell.
An excitation spectrum involves measuring the intensity F(l) at some particular lemission* as a function of the excitation wavelength (normalized to constant intensity). *In some cases the entire emission band is detected with . appropriate filtering.
An excitation spectrum involves measuring the intensity F(l) at some particular lemission* as a function of the excitation wavelength (normalized to constant intensity). A lack of correspondence between an excitation spectrum and the absorbence of the emitting molecule would suggest that the emission does not arise from the molecule contributing most to the absorption
An excitation spectrum involves measuring the intensity F(l) at some particular lemission* as a function of the excitation wavelength (normalized to constant intensity). A lack of correspondence between an excitation spectrum and the absorbence of the emitting molecule would suggest that the emission does not arise from the molecule contributing most to the absorption In the presence of non-radiative excitation transfer the excitation spectrum derived from the emission of the acceptor will contain enhanced contributions with excitation at wavelengths where the donor absorbs.
A Kinetic Model of Absorption and Emission Behavior S1 kix DI – rate of absorption . kf – fluorescence . kic – internal conversion . kix– intersystem crossing knr – internal conversion . kP – phosphorescence T kic DI kf knr kP S0
The rate of change of the [S1] with time can be expressed as: where DI represents the rate of absorption. This assumes that the [So] remains essentially constant. The constant k is actually the sum of k’s e.g. kf + kic + kix, or the sum of rate constants that contribute to the decay of [S1]. The rate equation is a 1st order differential equation of the form:
The rate of change of the [S1] with time can be expressed as: where DI represents the rate of absorption. This assumes that the [So] remains essentially constant. The constant k is actually the sum of k’s e.g. kf + kic + kix, or the sum of rate constants that contribute to the decay of [S1]. The rate equation is a 1st order differential equation of the form:
The rate of change of the [S1] with time can be expressed as: where DI represents the rate of absorption. This assumes that the [So] remains essentially constant. The constant k is actually the sum of k’s e.g. kf + kic + kix, or the sum of rate constants that contribute to the decay of [S1]. The rate equation is a 1st order differential equation of the form:
With an integrating factor the equation above can be expressed as: or with P(x) = k and Q(x) = DI: then: When t = 0, [S1] = 0, then: or: and
With an integrating factor the equation above can be expressed as: or with P(x) = k and Q(x) = DI: then: When t = 0, [S1] = 0, then: or: and
With an integrating factor the equation above can be expressed as: or with P(x) = k and Q(x) = DI: then: When t = 0, [S1] = 0, then: or: and
With an integrating factor the equation above can be expressed as: or with P(x) = k and Q(x) = DI: then: [S1] When t = 0, [S1] = 0, then: or: and
The fluorescence intensity is given by: For t >> t : F = ff DI i.e. a steady-state is reached, which for singlet excited states would occur in nanoseconds.