Download
1 / 36
430 likes | 669 Views
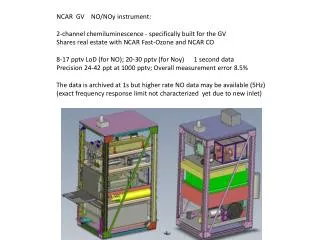
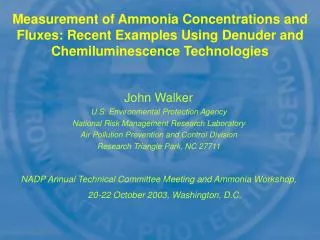
Measurement of Ammonia Concentrations and Fluxes: Recent Examples Using Denuder and Chemiluminescence Technologies. John Walker U.S. Environmental Protection Agency National Risk Management Research Laboratory Air Pollution Prevention and Control Division Research Triangle Park, NC 27711

E N D
Measurement of Ammonia Concentrations and Fluxes: Recent Examples Using Denuder and Chemiluminescence Technologies John Walker U.S. Environmental Protection Agency National Risk Management Research Laboratory Air Pollution Prevention and Control Division Research Triangle Park, NC 27711 NADP Annual Technical Committee Meeting and Ammonia Workshop, 20-22 October 2003, Washington, D.C.
Research and Development at EPA • 1,950 employees • $700 million budget • $100 million extramural research grant program • 13 lab or research facilities across the U.S. • Credible, relevant and timely research results and technical support that inform EPA policy decisions
Making decisions with sound science requires.. • Relevant, high quality, cutting-edge research in human health, ecology, pollution control and prevention, economics and decision sciences • Proper characterization of scientific findings • Appropriate use of science in the decision process Research and development contribute uniquely to.. • Health and ecological research, as well as research in pollution prevention and new technology • In-house research and an external grants program • Problem-driven and core research
High Priority Research Areas • Human Health • Particulate Matter • Drinking Water • Clean Water • Global Change • Endocrine Disruptors • Ecological Risk • Pollution Prevention • Homeland Security
NH3 NH4+ Ammonia Research within U.S.EPA/NRMRL/APPCD • Development of Emission Factors for Animal Production Bruce Harris, Richard Shores, and Susan Thorneloe Swine, Poultry, Cattle OP-FTIR/TDL with computed tomography • Natural emissions, atmospheric chemistry and deposition John Walker Spatio-temporal variability in NH3/NHx, air/surface exchange over crops, soil emissions
NH3 NH4+ Outline • Annular Denuder • Ambient monitoring in eastern North Carolina • Chemiluminescence NH3 Analyzer • Air/surface exchange of NH3 • Passive Denuder • Spatial gradients in the vicinity of a swine production facility
NH3 NH4+ Ambient Ammonia and Ammonium Aerosol across an Area of Variable Ammonia Emission Density Co-authors Wayne Robarge North Carolina State University, Department of Soil Science, Raleigh, NC 27695 Dave R. Whitall Center for Coastal Monitoring and Assessment, NOAA, Silver Spring, MD 20910 Hans W. Paerl University of North Carolina at Chapel Hill, Institute of Marine Sciences, Morehead City, NC 28557
NH3 NH4+ Background: Ammonia in North Carolina • Eastern North Carolina contains some of the highest county-scale NH3 emission rates in the U.S. (Sampson and Duplin Counties; Strader et al., 2001). • Livestock and fertilizer account for 90% (116,000 tons N) of statewide NH3 emissions.
Objective: Measurement of ambient NH3, NH4+, HCl, Cl-, HNO3, NO3-, SO2, SO42-, and HONO concentrations at sites in eastern NC. Period: 2000 NH3 NH4+ Background
* * * Morehead City Kinston Clinton N
Methods Teflon Filter Pack Contains Teflon and nylon Filters capture fine particulates containing ammonium and other species. Denuder Tube Concentric cylinders of etched glass are coated with citric acid. NH3 molecules are retained in this section. AIR FLOW Denuder Tube Concentric cylinders of etched glass are coated with sodium carbonate (base). Acid molecules (HCl, HONO, HNO3, SO2) are retained in this section. Cyclone Stops particulates >2.5 m in size from entering annular denuder system. Air Intake Schematic of assembled annular denuder system
NH3 NH4+ Conclusions • At the three sites investigated in this study, ambient levels of NH3 and inorganic PM2.5 exhibit a positive correlation with local NH3 emission density. • NH4+ aerosol formation appears to be acid-gas-limited at the Clinton site during all seasons and during the spring and summer at the Kinston site. • NH4+ aerosol formation may, therefore, be more sensitive to changes in SO2 and NOx emissions reductions in NH3 enriched areas.
NH3 NH4+ Air Surface Exchange of NH3 over Agricultural Crops Objective: Measurement of NH3 exchange over soybean, corn and winter wheat using the modified Bowen ratio approach. Period: 2002 – 2003 Site: Duplin County, NC Coastal Plain
NH3 NH4+ Theory Eddy Covariance y = momentum (u), heat (), mass (c) K-theory In this case, y = H2Ov, CO2, and Modified Bowen-ratio
Methods: Equipment NH3 gradient – Chemiluminescence CO2/H2O gradient – LI6262 Temperature gradient – Thermocouple Eddy Covariance CO2/H2O/Heat fluxes - LI7500/Gill Windmaster Pro Inlet Heights – 1 and 6m 15 min. switching time Heated sample lines Hourly gradients Hourly - RH PAR/Net radiation Rainfall Soil volumetric water Soil heat flux Weekly - LAI Leaf total N Soil extractable NH4+/NO3- NH3 flux tower - Duplin Co., NC
Methods: Tower NH3 Configuration Upper Inlet Heated Sample Line 8.5 Lpm Solenoid Valve 6.2 m Mobile Lab NH3 Analyzer Lower Inlet Nt Converter 11.4 m
NH3 NH4+ Methods: Chemiluminescence NOx PMT Nt Converter Inlet Nt NOx Converter Routine calibration with NO standard Converter efficiency test with NH3 standard Converter efficiency typically 65 – 85% NO Rx Cell Nt Converter Module NH3/NOx/NO Analyzer Nt converter at 825 oC converts NHx + NOx to NONOx converter at 325 oC converts NOx to NO
Hour 0 12 0 12 0 12 0 12 0 12 0 12 0 DOY 206 207 208 209 210 211 Methods: Instrument Comparison Concentrations
Methods: Instrument Comparison Gradients DOY 209 1:1
Methods: NH3 Gradients2002 Soybean 85% of gradients were > detection limit N = 2771
Results: NH3 Gradients and Fluxes2002 Soybean Net flux = -12 ng NH3-N/m2/s Vd = -0.35 cm/s
NH3 NH4+ Ammonia Concentrations Within the Vicinity of a Swine Production Facility Objectives: Measurement of horizontal NH3 gradients around a swine production facility from the housing/lagoon complex to 500 m. Estimation of NH3 dry deposition using the resistance approach (Fowler et al., 1998) and Gaussian modeling. Development of a mass balance using measured emissions (Harris et al., 2001).
N NH3 Sampler Met. Station Lagoon Hog House 500 m Site Layout
Methods [NH3] = Q/V Q = Mass of NH3 adsorbed V = Volume of air sampled Sutton et al., 2001 Q = (ce – cb)v Ce – Measured NH3 concentration Cb – Blank value V – Extract volume (2.5 ml) V = D•A•t/L D – Diffusion coefficient A – Area of adsorbing surface t – Duration of exposure (1 week) L – Length of diffusion path (35 mm)
Methods • DepositionFNH3 = [NH3]•Vd Vd = 1/(Ra + Rb + Rc) Rc will be calculated using the relationship between Rc and [NH3] (Fowler et al., 1998) and Gaussian modeling. Rb Rb = (2/(ku*))(Sc/Pr)2/3 Ra Ra = U/(u*)2 u*is determined using velocity profile (crops) and eddy covariance (forest) approaches
NH3 NH4+ Methods Results • Calibrate using NH3 standard in flow-through chamber and by comparison with annular denuder. • Measurements began April 2003 • Median C.V. = 6.4% (N = 236) • Mean Blank = 2.7 g NH3 m-3 (N = 86)
Results Extensions represent 95% C.I. for mean concentration.
NH3 NH4+ Summary • Annular Denuder • Multiple analytes, selective, well documented • Integrated sample, labor intensive, relatively expensive • Chemiluminescence • Good temporal resolution, easily calibrated, relatively inexpensive • Aerosol interference • Passive Denuder • Inexpensive, allows greater spatial resolution, selective • Single analyte, integrated sample, requires calibration
NH3 NH4+ Acknowledgements • North Carolina Division of Air Quality, North Carolina Pork Council, National Pork Producers Council, and North Carolina Water Resources Research Institute. • Wayne Fowler (U.S. EPA), Lynette Mathis (North Carolina State University), Mark Barnes (North Carolina State University), and Brad Hendrickson (UNC-CH IMS).