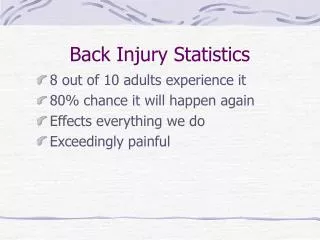
TALK BACK TO STATISTICS
TALK BACK TO STATISTICS. Achievement Standard 2.11. Evaluate a statistically based report with justification and insight Identify sampling and possible non-sampling errors in surveys including polls. Statistical Literacy ?.
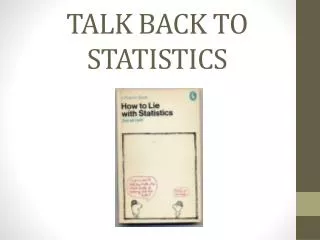

TALK BACK TO STATISTICS
E N D
Presentation Transcript
Achievement Standard 2.11 • Evaluate a statistically based report with justification and insight • Identify sampling and possible non-sampling errors in surveys including polls
Statistical Literacy ? • “ statistical literacy relates to two interrelated components, primarily (a) people’s ability to interpret and critically evaluate statistical information, data-related arguments, or stochastic phenomena,…..and (b) their ability to discuss or communicate their reactions to such statistical information. “ • ( Gal, 2002) • "…understanding the basic language of statistics (e.g., knowing what statistical terms and symbols mean and being able to read statistical graphs), and understanding some fundamental ideas of statistics." • ( Gaise Report, 2007)
Statistical Literacy • “ …the ability to interpret and evaluate critically statistical information in a variety of contexts and from a variety of media. It is also the ability to communicate that interpretation in a way that can impact decision-making” • ( Watson, 2006)
2.11 Overview • Prior knowledge • Student preparation for Unit • Importance of Context • Evaluation of Reports • Different forms of assessment delivery • Challenges
CONTEXT • Contextual knowledge is essential • Select a context that is appropriate for your students • In practice assessments encourage students to research topic before starting evaluation of report • Share knowledge discovered in brainstorm session • Potential for cross-curricular project
EVALUATION OF REPORTS • Develop a set of worry questions to include sampling problems, questionnaire design & delivery etc. • Explore probability misconceptions . For example, equiprobability bias, expression of probabilities • Research different types of data display. Technology allows students to be more innovative than the traditional bar chart, histogram, pie chart etc. • Get students to write their own reports of a data set complete with headlines and charts.
Who do you believe? • Link found between cell phone use and increase in brain tumours - WHO No evidence cell phones cause cancer : US oncologist - The Hindu BusinessLine News
“Worry Questions” • Examples • Who is the data about? Who or what was studied? • Where did the data come from? Who paid for the investigation or research? How was it collected? • Was a sample used? How was it sampled? Was the sample randomly selected and is it representative? • How reliable or accurate is the data? What measurements or questions were asked? Have measurements or terms been defined? • What is the shape of the distribution of the data? Have they used the correct summary statistics for the type of distribution? • Are there any outliers? What can you conclude from any outliers? • If there is a graph drawn – has it been drawn appropriately? • Are the claims made sensible and supported by the data? If a claim is made is it justified by facts? • Can you suggest any extra information or calculations that should have been carried out in order to evaluate the issue in question? • Are there any alternative explanations from causes not discussed that might result in a different interpretation of the data?
Assessment • COMMUNICATION ! • Powerpoint slideshow • Written report • Wiki page • Poster • Oral presentation – speech • Innovative data display
Challenges • Different methods of assessment delivery • Authenticity of work • Potential for cross-curricular study • Availability of resources
Useful Websites Evaluation of statistical reports • http://www.mercurynie.com.au/mathguys/mercury.htm • http://www.simerr.educ.utas.edu.au/numeracy/default.html • www.statschat.org.nz • www.offsettingbehaviour.blogspot.com • www.thestatsblog.wordpress • Innovative Data Display • www.coolinfographics.com • www.infographicsshowcase.com • http://www.smashingmagazine.com/2007/08/02/data-visualization-modern-approaches/
Over to You ! • GROUP ACTIVITY • TWO REPORTS with apparently opposing views. Is the evidence convincing ? • Report Back – Are you convinced by the headline. What evidence was presented to convince you? • Are you sceptical of the headline claims ? What evidence was presented that you are unsure of ? • CONCLUSION – Will the article affect the way you use a cell-phone ?
Importance of Statistical Literacy ? HG WELLS “ Statistical thinking will one day be as necessary for efficient citizenship as the ability to read or write.” ( end of 19th century)