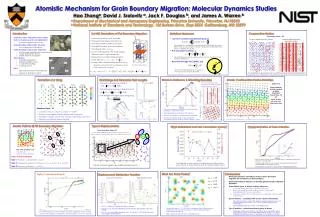
Temperature Dependence of Grain Boundary Migration in 3-D Models
This study investigates the temperature dependence of grain boundary migration (GBM) utilizing atomic simulation models. Authored by Hao Zhang and David J. Srolovitz from Princeton University, the research incorporates a modeling approach that evaluates the driving force dependence and mobility of GBM. Key findings include the effect of temperature on activation energy, grain boundary energy, and reduced mobility. Using FCC aluminum <111> tilt grain boundaries, the results reveal insights into migration rates and the interplay of driving forces, which are crucial for understanding grain growth processes.

Temperature Dependence of Grain Boundary Migration in 3-D Models
E N D
Presentation Transcript
Temperature Dependence of Grain Boundary Migration in 3-D Hao Zhang David J. Srolovitz Princeton University Princeton Materials Institute (PMI) Acknowledgements Moneesh Upmanyu ORNL Lasar Shvindlerman Russian Academy of Sciences/RWTH Gunther Gottstein RWTH Aachen S. Srinivasan LANL
Outline • Atomic Simulation Model • Modeling Approach • Driving Force Dependence of Migration • Recent 3-D Results (Temperature Dependence) • Reduced Mobility • Grain Boundary Energy • Mobility • Activation Energy • Conclusions
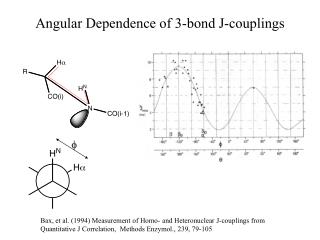
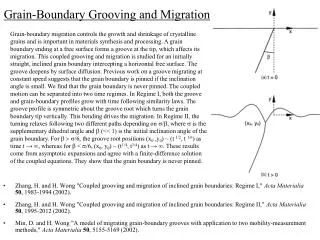
Grain Boundary Migration • Grain boundary migration • Absolute reaction rate theory(Turnbull, 1951) • Grain growth (capillarity-induced migration)
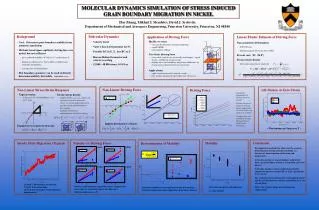
v(y) Modeling Approach • U-shaped half loop geometry • FCC Aluminium <111> Tilt Grain Boundary • EAM – Al • Periodic along X, Y and Z • Local velocity • Steady-state velocity • Boundary energy
Reduced Mobility Mgbggb (ao/t) Migration rate v (ro/t) Grain Boundary Energy (J/m2) Driving Force k=p/w (nm-1) Driving Force Dependence of Migration • For sufficiently low driving forces : • Reduced mobility is independent of driving force (2-D) • Migration rate is proportional to driving force (2-D) • Grain Boundary Energy is large (3-D)
Grain Boundary Migration S7 Grain Boundary at T=427K
S13 S7 M* vs. Misorientation (m4/Js) (deg)
S13 S13 S7 S7 Mobility and γ vs. Misorientation (J/m2) (m4/Js) (deg) (deg)
S13 S7 Mobility vs. Misorientation (m4/Js) (deg)
Simulation Experiments Temperature Dependence of Mobility
Simulation S13 S7 S7 Q (eV) Misorientationq(deg) Activation Energy vs. Misorientation experiment (eV) (deg)
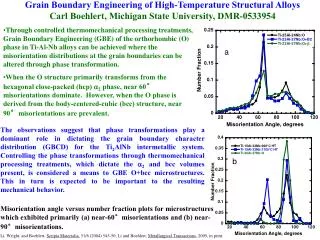
Conclusions • Reduced mobility shows local maxima at low S7 • Mobility shows maxima at low S misorientations • Boundary energy exhibits minima at low Smisorientations • Magnitude of activation energy in simulation << than in experiment • Possible reasons: simulations do not represent the true physics impurities