Download

1 / 36
360 likes | 499 Views
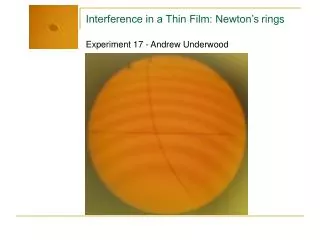
Experiment 17 - Andrew Underwood. Purpose. The purpose of this experiment was to show how light interference works in a thin film Part 1: Thin wedge consecutive lines of fringes Part 2: Newton’s Rings circles of fringes. Theory. Index of refraction glass n = 1.5 air n = 1.0

E N D
Purpose • The purpose of this experiment was to show how light interference works in a thin film • Part 1: Thin wedge • consecutive lines of fringes • Part 2: Newton’s Rings • circles of fringes
Theory • Index of refraction • glass n = 1.5 • air n = 1.0 • When nA > nB • rays reflecting from the side where n=nA reflect the same phase • rays reflecting from the side where n=nB experience a phase reversal
Theory • A phase reversal is equivalent to shifting the ray by half a wavelength Diagram from Physics 294 Laboratory Manual, page 17-1
Theory • When waves interfere constructively:
Theory • When waves interfere destructively:
Theory • When waves interfere destructively:
Theory Part 1 Diagram from Physics 294 Laboratory Manual, page 17-2
Theory Part 1 • Two glass plates at an angle cause the space between them t to increase with x • t = /2 = x tan • Where • t is the distance between the two pieces of glass • is the wavelength of the light • x is the distance between consecutive fringes • is the angle between the glass • tan = t / x • Since is constant, t / x should be constant • Implies fringes happen at regular intervals
Theory Part 2 Diagrams from Physics 294 Laboratory Manual, page 17-3
Theory Part 2 • rm2 = xm2/4 + 2 = mR • Where • rm is the actual radius of the mth fringe • xm is the measured diameter • is the perpendicular offset from the center of the ring • m is the order of the ring • m=0 for the bulls eye • m=1, 2, 3, … for each consecutive ring • is the wavelength of the light • R is the curvature radius of the plano-convex lens
Apparatus Diagram from Physics 294 Laboratory Manual, page 17-2
Procedure Part 1 • The distance from an arbitrary (m=0) fringe to 20 consecutive dark fringes was measured • The difference between each fringe was calculated • x = xn - xn-1 • From x we can calculate • /2 = x tan
Procedure Part 2 • Position the microscope over the center of the bulls eye • Measure xL and xR to get xm for 10 rings • xm = |xL - xR| • Plot xm2 versus m to find R and 2 • xm2/4 + 2 = mR • xm2 = mR/4 - 2/4 • y = mx + b
Analysis Part 1 • Error for x • x = (x)2 + (x)2 • x = 2(x)2 • x = 2(0.004 cm)2 • x = 0.006 cm
Analysis Part 1 • Average x = 0.050 • Excel “=AVERAGE(x)” • Standard Deviation x = 0.004 • Excel “=STDEV(x)”
Analysis Part 1 • t = /2 = x tan • /2 = x tan • for sodium light is 589.3 nm = 5.893*10-7m • x average was 0.050 cm = 5.0 * 10-4m • Solve for • (5.893*10-7m)/2 = (5.0 * 10-4m ) tan • = 3.4 * 10-2 degrees
Analysis Part 1 • For small angles (tan) • (tan) = (/2) / x • (tan) = (5.893*10-7m )/2 / (6*10-5 m) • (tan) = .004 • = 0.034 +/- .004 degrees
Analysis Part 2 • xm2 = xm2 * (xm/xm)2 +(xm/xm)2 • xm2 = xm2 * 2(xm/xm)2 • x12 = (0.062 cm) * 2(0.006/0.248)2 • x12 = 0.002
Used Excel’s LINEST() function to calculate slope and intercept • Slope = 0.0555 +/- 0.0006 • Intercept = 0.006 +/- 0.004
Analysis Part 2 • xm2 = mR/4 - 2/4 • y = 0.0555x + 0.0064 • y = mx + b • To find 2 • - 2/4 = 0.006 • 2 = -0.024 cm2 • 2/4 = 0.004 • 2 = 0.02 • 2 = -0.02 +/- 0.02 cm2
Analysis Part 2 • xm2 = mR/4 - 2/4 • y = 0.0555x + 0.0064 • y = mx + b • To find R • mR/4 = 0.0555x where x = m • = 589.3 nm = 5.893 * 10-5 cm • (5.893 * 10-5 cm)R/4 = 0.0555 • R=3.767 * 103 cm
Analysis Part 2 • R/4 = 0.0006 • R = 0.0006 * 4 / • R = 0.0006 * 4 / 5.893 * 10-5 cm • R = 40 cm • R = 3.77 * 103 +/- 0.04 * 103 cm
Conclusion • We were able to see how rays of light could interfere causing fringes • Dark fringes: destructive interference • Bring fringes: constructive interference • Interference explains colours in a thin film
Conclusion • Measured distance between fringes • Able to calculate the thin film’s properties • In Part 1 we were able to calculate • = 0.034 +/- .004 degrees • In Part 2 we found • 2 = -0.02 +/- 0.02 cm2 • R = 3.77 * 103 +/- 0.04 * 103 cm
Conclusion • Errors • Error in positioning the travelling microscope over the same place for each fringe • Error in taking measurements from the micrometer scale • Error would arise in Part 1 if the fringes were not aligned perpendicular to the direction of the travelling microscope
Conclusion • Experiment could be improved • by using a travelling light sensor instead of a microscope
Questions? • Additional pictures at www.goldenratio.ca