Download

1 / 12
140 likes | 331 Views
Flood Mapping and Function of Flood Plains. Multifunctional Hydrological Roles in Cambodian Flood Plain Project (TSLV). Manithaphone Mahaxay, MRCS. Water Level Observation Stations, Mekong River and Floodplain. St. 7. Zone 1. Kampong Cham. 1. Mekong River. 2. Tonle Sap. 4. 9. 8.

E N D
Flood Mapping and Function of Flood Plains Multifunctional Hydrological Roles in Cambodian Flood Plain Project(TSLV) Manithaphone Mahaxay, MRCS
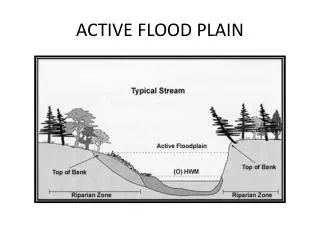
Water Level Observation Stations, Mekong River and Floodplain St. 7 Zone 1 Kampong Cham 1 MekongRiver 2 TonleSap 4 9 8 Zone 2 3 20 Chrui Changvar 5 10 12 Koh Norea Zone 5 11 Phnom Penh Mekong River 6 13 14 Bassac 7 Neak Leung 18 15 Zone 3 Zone 4 19 17 16
Water Level (2002) Mekong River Floodplain Mekong-Tonle Sap Zone 2 East Side Zone 5 July August Sept. Oct. Nov. Dec. July August Sept. Oct. Nov. Dec.
Major Roads Open Water Floods Rising Flood Condition in 2002 – RADARSAT ScanSAR Image Derived Hydrology ScanSAR Narrow B, August 27, 2002 RADARSAT Image in July 2002 to January 2003 were used to check the extent of floodplain lands inundated
Discharge Measurement Campaign (2002 ) Kratie • Flood Plains by TSLV Project • Main Stream by Other Projects Site B,B+ Prek Kdam Kompong Cham • TSLV Project Teams • Site A (National Road 6 & 6A • Site B (National Road 1 & 11) • Site B+ (National Road 70) Zone 2 Tonle Sap Moat Kumong Zone 5 Mekong River • WUP-JICA Project Team • Kompong Cham • Chrui Changvar • Phnom Penh Port • Monivong Bridge • Koh Norea • Koh Khel (Bassac) • Neak Luong • Prek Kdam Site A Zone 4 Neak Luong Bassac Tan Chaw • Component 1 Project Teams • Kratie • Moat Kumong (National Road 7) Chaw Doc Measuring weekly discharge around zone 2 & 5
Mekong River Hydrographs 2002 Results of the flow gaugings for a few mainstream sites
Estimation of Net flow Volume (July 10 to Nov.17 , 2002) Moat Khmong Bridge Reverse -12 Normal +16 Kg Cham 12 Prek Kdam Reverse-42 Normal+32 Zone 2 5 5 365 -10 4 15 8 5 Mekong River 13 35 Tonle Sap Zone 5 Observed by WUP JICA team 3 305 Phnom Penh Port Reverse -34 Normal +37 269 51 Observed by TSLV team 17 Observed by Component1 Bassac Estimated by Water Balance 7 Mekong River 3 Zone 4 5 Unit: Billion m3 Koh Khel Neak Leung 14 282
Model results (discharges) in main rivers Discharges (ADCP) Flow towards lake Observation (ADCP) Simulation Flow from lake Mekong River Tonle Sap showing flow reversal Observations shown with dots Model results shown with lines Mekong River u/s and d/s of junction showing storage function of Great Lake Bassac showing effect of flood plain spill Monivong Bridge Chrui Changvar Koh Norea Koh Khel Reasonable accuracy on hydraulic conditions and the conditions of flood plain such as water levels, flows & flood extent
Flood plain results dd P1 Similarly observed and simulated water levels and discharges Water levels at selected stations dd P3 Discharges at selected bridges dd P10 Levels relative to Hatien MSL datum
Simulated Observed August 15th 2002 Simulated Simulated Simulated Simulated Observed September 20th 2002 Observed October 14th 2002 Observed November 20th 2002 Observed December 25th 2002 Flood plain inundation Depth [m] An example of observed and model predicted flood extent
Flow Regulation Function • Flood Peak Cut by storing water in the Flood plain • Flow increase in dry season by releasing water from flood plain Channel flow Without flood plain Channel flow Regulated by flood plain Flood Peak cut Flow increase in dry season by flood plain Flood Mitigation volume by flood plain Flow increase effect Wet Season Dry Season