Download
1 / 14
140 likes | 165 Views
This supplementary material provides information on the RNA analysis conducted in a study on chronic lymphocytic leukemia (CLL), including details of the methods used and the results obtained. It also includes supplementary tables and figures that support the findings of the study.

E N D
SUPPLEMENTARY MATERIAL Krysov et al. Supplementary methods Supplementary Tables S1 and S2 Supplementary Figures S1 to S9
Supplementary methods RNA analysis Total RNA was isolated using the RNeasy kit (QIAGEN, Crawley, UK) according to the manufacturer’s instructions and converted to cDNA using oligo(dT) primers and M-MLV reverse transcriptase (Promega, Southampton, UK). For analysis of XBP1S RNA we used the approach described previously (Bagratuni et al. 2010). For quantitative PCR (Q-PCR), PCR reactions were performed using a 7500 Real Time PCR System and TaqMan Universal PCR Master Mix (Applied BioSystems, Warrington, UK) and the following TaqMan probes: Human B2M (beta-2-microglobulin) endogenous control (4333766T), XBP1 (Hs02856596_m1), CHOP (Hs99999172_m1). Relative RNA quantities were calculated with the equation RQ=2-(∆∆CT) using B2M expression as an internal control and normalized so that the expression in normal B cells, or control CLL cells was set to 1.0. Published gene expression array (GEA) data (accession: GDS4176)(Herishanu et al. 2011) were analyzed using the NCBI Gene Expression Omnibus browser (http://www.ncbi.nlm.nih.gov/geo/). Protein analysis Immunoblotting was performed using the following antibodies: anti-phospho-ERK1/2 (9101), anti-ERK1/2 (9102), anti-PERK (5683), anti-BIP (3183), anti-phospho-AKT (S473) (4060), anti-AKT (9272), anti-phospho-eIF2 (S51) (3597), anti-eIF2 (2103) (all from Cell Signaling Technology, Hitchin, UK), anti-XBP1 (619501; BioLegend, London, UK) and anti-β-actin (2066; Sigma-Aldrich, Poole, UK). Secondary horseradish peroxidase-conjugated antibodies were from GE Healthcare (Little Chalfont, UK). Densitometry analysis of immunoblot images was performed using Quantity One software (BioRad). In experiments with longer incubations (>6 hours), cells were treated with the caspase inhibitor zVADfmk (50 M, Calbiochem) to minimize secondary events due to apoptosis. Immunohistochemical analysis was performed using a tissue-microarray prepared from formalin fixed and paraffin embedded lymph node (LN) tissue sections from 11 cases of CLL/small lymphocytic lymphoma (SLL). Immunostaining was performed on sections after deparaffinisation and citrate buffer (pH 6.0) antigen retrieval with anti-XBP1 (ab37152; Abcam), anti-PERK (5683; Cell Signaling Technology) or anti-Ki-67 (MIB1; Dako, Stockport, UK) primary antibodies at a 1:100 dilution. Diaminobenzidine was used for staining development and the sections were counterstained with Mayer’s haematoxylin. Multiple myeloma sections were used as a staining positive control.
Cell treatments For sIgM stimulation, CLL cells were cultured at 1x10⁷/ml and treated with 20 g/mL soluble goat F(ab')2 anti–human IgM (Southern Biotechnology, Cambridge, UK) or goat F(ab')2 anti–human IgM coated M-280 Dynabeads (Invitrogen, Paisley, UK). The preparation of anti-IgM-coated beads was as described.(Coelho et al. 2013) Cells were treated with antibody-coated beads at a ratio of 2 beads per cell. As controls, cells were treated with soluble or bead-bound, non-immune goat F(ab')2 (Southern Biotechnology). In experiments using chemical inhibitors, cells were pretreated with ibrutinib or tamatinib (both 10M; Selleckchem, Newmarket, UK) for 1 hour prior to stimulation with anti-IgM. Thapsigargin and brefeldin A were from Sigma-Aldrich. Statistics Statistical analyses were performed using GraphPad Prism 6 software (GraphPad, San Diego, CA, USA). Bagratuni T, Wu P, Gonzalez de Castro D, et al. XBP1s levels are implicated in the biology and outcome of myeloma mediating different clinical outcomes to thalidomide-based treatments. Blood. 2010;116(2):250-253. Herishanu Y, Perez-Galan P, Liu D, et al. The lymph node microenvironment promotes B-cell receptor signaling, NF-kappaB activation, and tumor proliferation in chronic lymphocytic leukemia. Blood. 2011;117(2):563-574.
Table S1 aBinet stage at diagnosis. bU, unmutated; M, mutated. c% positive cells dNK, not known; ND, not determined.
Table S2 aCores for sample 3 were missing from the tissue microarray.
Figure S1 PERK ATF6 IRE1 ATF4 Phospho eIF2 p50 ATF6 XBP1 splicing Phospho JNK CHOP BIP GADD34 CHOP XBP1 BIP ERAD ERAD ER expansion RNA translation Overview of UPR pathways. The UPR is controlled by three endoplasmic reticulum (ER)-resident sensor proteins IRE1, PERK and ATF6. ER stress leads to dissociation of the ER chaperone BIP (GRP78) from these sensors leading to their activation. Full UPR activation is associated with ATF6 transit to the Golgi where it is proteolytically activated. The resultant 50 kDa ATF6 fragment (p50 ATF6) is a nuclear transcription factor that induces expression of UPR-associated genes, including BIP, CHOP and XBP1, and components of the ERAD (endoplasmic reticulum-associated protein degradation) system. IRE1 undergoes autophosphorylation which activates its endoribonuclease activity resulting in a removal of 26-base pair fragment from XBP1 RNA. The XBP1 splice variant is translated into XBP1S, a transcription factor which induces expression of chaperones and ERAD proteins. The UPR is a highly flexible response system and variable activation of its downstream effector arms in different cell types or in response to stimuli of differing strength/duration, fine-tunes responses ranging from survival to apoptosis. Prolonged, high-level UPR responses are linked to cell death which is predominantly mediated by JNK1, downstream of IRE1, and, in some cell types, induction of CHOP.
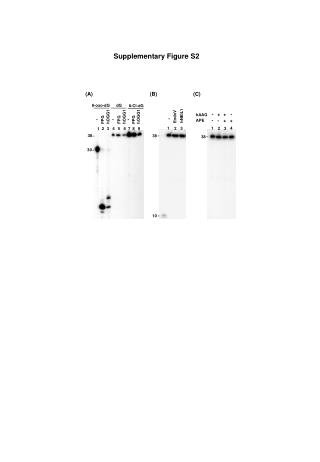
A Figure S2 B control TG control TG Time (h): 3 6 24 3 6 24 3 6 24 3 6 24 PERK P-eIF2 eIF2 BIP β-actin CLL500 CLL489 Regulation of the UPR in thapsigargin-treated CLL cells CLL cells were treated with thapsigargin (TG; 15M) or left untreated as a control (Co).Cells were collected after 3, 6 or 24 hours. (A) Q-PCR analysis of CHOP and XBP1 RNA expression. (B) Immunoblot analysis of PERK, total eIF2, phosphorylated eIF2, BIP and -actin (loading control). Phosphorylated and non-phosphorylated forms of PERK are indicated by white and black triangles, respectively. For (A), CHOP/XBP1 RNA expression values were normalised to B2M expression and normalised expression values of control cells at 6 hours were set to 1.0. For (B), cells were incubated throughout the experiment in the presence of zVADfmk (50mM) to suppress apoptosis. Data shown were obtained using two samples and are representative of results obtained with 15 samples.
Figure S3 A B 277 279 344 353 control TG XBP1 XBP1 XBP1S XBP1S BACT BACT XBP1S RNA expression in untreated and thapsigargin-treated CLL cells Analysis of full length and spliced XBP1 RNA in CLL cells using RT-PCR. BACT RNA expression is shown as a control. (A) Representative CLL sample treated with thapsigargin (TG; 15M). (B) Untreated CLL samples. Data shown are representative of results obtained with 30 different samples.
Figure S4 A B C D E F Correlations between CHOP and XBP1 RNA expression and prognostic features of CLL. Correlations between basal CHOP and XBP1 RNA expression and (A,B) IGHV mutation status, (C,D) CD38 expression and (E,F) ZAP70 expression in all samples. The statistical significance of differences was analyzed using the Mann-Whitney test.
Figure S5 ICsol anti-IgMsol ICbead anti-IgMbead 0.5 1 3 6 8 24 0.5 1 3 6 8 24 0.5 1 3 6 8 24 0.5 1 3 6 8 24 P-ERK P-AKT -actin P-ERK P-AKT -actin Effects of soluble or bead-bound anti-IgM on kinase activation CLL samples were stimulated with soluble (sol) or bead-bound anti-IgM (anti-IgMbead) or isotype control (IC) antibodies for up to 24 hours in the presence of zVADfmk. Expression of phosphorylated ERK1/2 (T202/Y204), phosphorylated AKT (S473) and β-actin was analyzed by immunoblotting. Data shown are representative of results obtained with more than 15samples.
Figure S6 PERK and BIP expression in control and soluble anti-IgM-treated non-responsive CLL samples. sIgM non-responsive CLL samples (n=4) were incubated with soluble anti-IgM for 3, 6 or 24 h and expression of PERK and BIP was analyzed by immunoblotting.Expression values were normalised so that the mean value in control cells at each time point was set to 1.0. Graphs show mean values (±SD). The statistical significance of the differences between control and anti-IgM treated cells are shown for each time point (paired Student’s t-test).
Figure S7 Comparison of anti-IgM-induced PERK/BIP expression and ERK1/2 phosphorylation in signal responsive samples. Parallel immunoblotting was used to quantify PERK, BIP and ERK1/2 phosphorylation for 9 of the samples analyzed in Figure 5 of the main manuscript. Expression values were normalized to -actin. We then calculated the expression of each marker in bead-bound-anti-IgM treated cells relative to control cells at the same time point. Graphs include comparisons for data for all time points and show results of linear regression and Spearman correlations.
Figure S8 time (h) 6 24 6 24 control + + - - - - + + anti-IgM PERK BIP -actin PERK and BIP expression in control and anti-IgM-treated normal B cells. Normal B cells (anti-CD138-depleted) were incubated with soluble anti-IgM or isotype control antibody for 6 or 24 h and expression of PERK, BIP and -actin (loading control) was analyzed by immunoblotting.Results are representative of two independent preparations of cells.
Figure S9 Antigen Anergy “Positive” signaling Strongly downmodulated sIgM responses basal ERK-P Retained sIgM responses basal UPR MCL1, MYC A model linking differential antigen signaling via sIgM to modulation of the UPR. Antigen signaling results in two predominant signaling responses in CLL; anergy linked to a good prognosis and “positive” growth-promoting signaling linked to more aggressive behavior. BCR-induced UPR activation appears to be linked to positive signaling since basal UPR expression is highest in the subset of samples which retain sIgM signaling responsiveness and is further elevated following treatment with anti-IgM in vitro in signal responsive samples.