Download
1 / 14
150 likes | 427 Views
Supplementary Material Supplementary Tables Supplementary Table 1. Sequencing statistics for ChIP-seq samples. Supplementary Table 2. Pearson correlation coefficients for ChIP-seq biological replicates based on read counts .

E N D
Supplementary Material • Supplementary Tables • Supplementary Table 1. Sequencing statistics for ChIP-seqsamples. • Supplementary Table 2. Pearson correlation coefficients for ChIP-seq biological replicates based on read counts. • Supplementary Table 3. Sequencing statistics for RNA-seqsamples and Breakdown of RNA-seq mapping. • Supplementary Table 4. Excel file with ChIP-seq data. • Supplementary Table 5. Excel file with RNA-seq data. • Supplementary Table 6. Excel file with data related to antisense and intergenic transcription. • Supplementary Table 7. Excel file with transcriptional unit identification. • Supplementary Table 8. Excel file with comparison of RNA-seq data generated in this work with those published in Arnvig et al, 2011. • Supplementary Figures • Supplementary Figure 1. Scatter plots and Pearson correlation coefficients between RNAP and NusA feature counts in exponential and stationary phase datasets. • Supplementary Figure 2. qPCR validation of ChIP-seqdata. • Supplementary Figure 3. Distribution of exponential and stationary phase RPM values across all M. tuberculosis functional categories. • Supplementary Figure 4. qRT-PCR validation of RNA-seq data. • Supplementary Figure 5. Anti-sense transcription in M. tuberculosis in Exp phase. • Supplementary Figure 6. Anti-sense transcription in M. tuberculosis in Stat phase. • Supplementary Figure 7. Intergenic transcription in M. tuberculosis. • Supplementary Figure 8. Scatter plots indicating the correlation between RNA-seq data generated in this work and those published in Arnviget al., 2011. • Supplementary Figure 9. Plot of the cumulative RPM for TUs on the forward and reverse strand against TU Start.
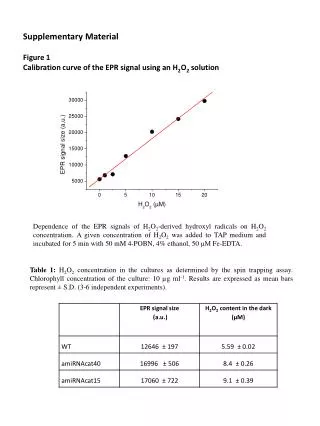
Supplementary Table 1. Sequencing statistics for ChIP-seq samples.
Supplementary Table 2. Pearson correlation coefficients for ChIP-seq biological replicates based on read counts.
Supplementary Table 3 A) Sequencing statistics for RNA-seq samples. B) Breakdown of RNA-seq mapping.
A B r2 = 0.67 r2 = 0.59 Supplementary Figure 1. Scatter plots and Pearson correlation coefficients between RNAP and NusA feature counts for all CDS and inter-CDS regions in exponential (A) and stationary phase (B) datasets.
A B C Supplementary Figure 2 (legend on next page).
Supplementary Figure 2.qPCR validation of ChIP-seq data. (A)qPCR validation of RNAP ChIP-seq data obtained in Exp phase. Eight features, including promoter regions (P), IG regions and CDSs were selected for qPCR validation based on their enrichment ratios (ER) in ChIP-seq experiments with RNAP in Exp phase. The table reports full comparison of the log2 values obtained in qPCR after normalization to the input sample with log2 figures calculated from the ChIP-seq profile. The correlation coefficient is indicated on the graph. (B)qPCR validation of RNAP ChIP-seq data obtained in Stat phase. Eight features, including promoter regions (P), IG regions and CDSs were selected for qPCR validation based on their enrichment ratios (ER) in ChIP-seq experiments with RNAP in Stat phase. The table reports full comparison of the log2 values obtained in qPCR after normalization to the input sample with log2 figures calculated from the ChIP-seq profile. The correlation coefficient is indicated on the graph. (C)qPCR validation of NusA ChIP-seq data obtained in Exp phase. Twelve features, including promoter regions (P), IG regions and CDSs were selected for qPCR validation based on their enrichment ratios (ER) in ChIP-seq experiments with NusA in Exp phase. The table reports full comparison of the log2 values obtained in qPCR after normalization to the input sample with log2 figures calculated from the ChIP-seq profile. The correlation coefficient is indicated on the graph.
A B Supplementary Figure 3. Distribution of exponential and stationary phase RPM values across all M. tuberculosis functional categories. (A)Dynamic range of RPM values in Exp phase. (B)Dynamic range of RPM values in Stat phase.
Supplementary Figure 4. qRT-PCR validation of RNA-seq data. Twelve features, including CDSs, IG regions and anti-sense transcripts, were selected for validation by qRT-PCR using RNA from Exp and Stat phase. Data were normalized to the total amount of RNA. Results are expressed as log2 of the Exp/Stat ratio calculated from RPM values and from qRT-PCR figures. The correlation coefficient is indicated on the graph.
A B C 5,000 3,000 5,000 RNAP Exp 5,000 1,000 5,000 NusAExp 500 100 100 RNASeqExpfwd strand 500 100 100 RNASeqExp rev strand 5,000 3,000 5,000 RNAP Stat 5,000 1,000 5,000 NusA Stat 500 100 100 RNASeq Stat fwd strand 500 100 100 RNASeq Stat rev strand ino1 rv0842 rv0061 Supplementary Figure 5. Anti-sense transcription in M. tuberculosis in Exp phase. Examples of anti-sense transcription profiles visualized using the UCSC genome browser. The genome annotation is provided between the Exp and Stat tracks. The scale is shown at the top. The scale for the number of reads is displayed on the y-axis. (A)Anti-sense RNA starting in the middle of the ino1 CDS. (B)Anti-sense RNA starting inside rv0842 and extending upstream of the CDS. (C)Anti-sense transcription of rv0061.
A B RNAP Exp 20,000 3,000 5,000 1,000 NusAExp 100 500 RNASeqExpfwd strand 100 500 RNASeqExp rev strand 3,000 4,000 RNAP Stat 3,000 5,000 NusA Stat 500 100 RNASeq Stat fwd strand 500 100 RNASeq Stat rev strand rv3684 rv1734c Supplementary Figure 6.Anti-sense transcription in M. tuberculosis in Stat phase. Examples of anti-sense transcription profiles visualized using the UCSC genome browser. The genome annotation is provided between the Exp and Stat tracks. The scale is shown at the top. The scale for the number of reads is displayed on the y-axis. (A)Anti-sense transcription starting in rv3684. (B)Anti-sense RNA starting downstream of the rv1734c CDS.
A B C 5,000 3,000 1,000 RNAP Exp 1,000 1,000 3,000 NusAExp 100 100 100 RNASeqExpfwd strand 100 100 100 RNASeqExp rev strand 5,000 1,000 3,000 RNAP Stat 1,000 3,000 1,000 NusA Stat 100 100 100 RNASeq Stat fwd strand 100 100 100 RNASeq Stat rev strand IG rv3218 – rv3219 IG rv3648c – rv3649 IG rv1144 – rv1145 Supplementary Figure 7.Intergenic transcription in M. tuberculosis. Examples of intergenic transcription profiles visualized using the UCSC genome browser. The scale is shown at the top. The scale for the number of reads is displayed on the y-axis. (A)IG between rv3218 and rv3219. The long 5’-UTR of rv3219is evident. (B)IG between rv3648c and rv3649. The long 5’-UTR of rv3648c corresponds to the RNAP peak. (C)IG between rv1144 and rv1145, where an sRNAis transcribed.
A B r2 = 0.42 r2 = 0.36 Arnviget al. Arnviget al. This study This study Supplementary Figure 8.Scatter plots and Pearson correlation coefficients for (A) Sense, and (B) Anti-sense RPM counts from the exponential phase for all CDS regions in Arnviget al. and this study.
A Exponential Phase B Stationary Phase Forward Strand Forward Strand Cumulative RPM Cumulative RPM Reverse Strand Reverse Strand Genomic Position Genomic Position Supplementary Figure 9. Plot of the cumulative RPM (normalized to 1 for the total sum) for TUs on the forward and reverse strand against TU Start (genomic position in fraction of genome size) in (A) Exponential Phase and (B) Stationary Phase. The two curves are significantly different on a Kolmogorov-Smirnov test (p < 10-10 in both conditions).