Download
1 / 21
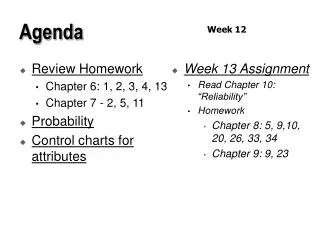
210 likes | 236 Views
Explore the mechanisms of gene flow and natural selection in driving evolutionary changes. Learn about allele frequencies, population structures, and the impact of migration on genetic diversity. Dive into examples like directional selection in peppered moths and the effects of inbreeding on heterozygosity. Understand the genetic consequences of inbreeding and how it affects allele frequencies and phenotypic expressions.

E N D
BSCI 363: read the rest of chapter 9 CONS 670: read the rest of chapter 7, and chapter 9
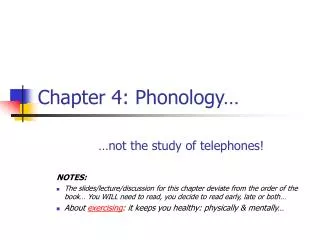
stabilizing directional disruptive As natural selection begins P decreases H depends on genotype favored by selection After selection has occurred 26
stabilizing directional disruptive As natural selection begins After selection has occurred P H P H P H ? ? ? 26
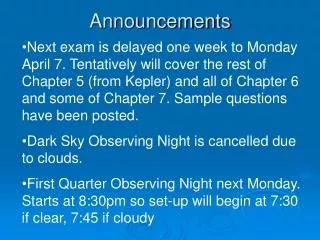
Dynamic Effects: Natural Selection maintains allele frequencies in equilibrium with environmental demands vs. Genetic Drift pulls allele frequencies away from environmental equilibrium 31a-2
5 causes of microevolution 1) genetic drift - stochastic variation in inheritance 2) Assortative mating 3) Mutation 4) Natural selection 5) Migration (gene flow) 31a-2
Emigration / Immigration Pollen grains Recipient population Donor population emigration from one population and immigration into the other; breeding = Gene flow Migration (m) of breeding individuals results in increased H and increased P 41f4
Models of gene flow based on population structure metapopulation subpopulation 1. Continent to island model e.g., Madagascar (source - sink model) 2. Equivalent island model e.g., Philippines 30-1
3. Stepping-stone model e.g., Hawaiian Islands 4. Isolation by distance model (continuous habitat) e.g., Amazon forest Genetic neighborhood 30-2
Gene flow results in homogenization of allele frequencies on “islands” of equivalent size. * A = .6 Before gene flow: A = .7 A = .5 A = .4 A = .55 A = .55 .7 .6 .5 .4 After: m A = .55 A = .55 X = .55 * assume thorough gene flow between populations 30e
Changes in allele frequency due to migration mij = gene flow = # breeding immigrants from donor population j size of recipient population i migrants (m) moving from donor (j) to recipient (i) Change in allele frequency (q) in population i: Before After Recipient i qi qi’ = (1-mij) qi + mij qj Donor j qj qj j i “jump” “into” 41A
Gene flow example Donor population (j) Recipient (i) Before Ne = 200 Ne = 300 qj = 0.9 qi = 0.5 After qj’ = 0.9 qi’ = 0.51 mij = 5 = 0.0167 300 qi’ = (1 - mij) qi + mij(qj) = (1 - 0.0167) (.5) + (0.0167) (0.9) = (0.5067) = 0.51 (If number of immigrants = 50, then qi’ = 0.57) 5 individuals 41e
Gene flow: major points 1) High mij homogenizes allele frequencies in two populations 2) Rate of gene flow influences Ne of recipient population and metapopulation 3) A small amount of gene flow may counteract genetic drift and conserve genetic diversity in small populations 4) Allele frequency in the donor population is assumed to be unchanged after gene flow to recipient population 5) Size of donor population does not influence allele frequencies in recipient populations 6) Applications: calculate number of individuals needed to introduce into recipient population of known size to maintain its genetic diversity. 41f1
Directional selection in peppered moths (Biston betularia) in England 2 phenotypes: black moth, mottle white moth Prior to 1600 (Industrial revolution) black form approximately 1% white form approximately 99% After 1600 (widespread industrial pollution, smoke and soot) black form approximately 90% white form approximately 10% Now (local pollution from smokestacks) Near pollution source Away black form 50% 10% white form 50% 90% Outbreeding depression? 41
Selection and gene flow:colonization along an environmental gradient Cold-adapted favored m m m m mountain m Warm-adapted favored 42
Effect of inbreeding on H Selfing: In a population with f (a) = f (A) = 0.5 At Hardy-Weinberg equilibrium, genotypic frequencies are p2 + 2pq + q2 = 1 AA Aa aa Parental genotypic frequencies: .25 .50 .25 F1 homozygotes .25 .25 F1 heterozygotes .125 .25 .125 F1 genotypes .375 .25 .375 Conclusion: Frequency of heterozygotes is reduced by 50% with each generation of selfing. But there is no loss of allelic diversity: f (a) = f (A) = 0.5 43
The case of selfing with some random mating too The frequency of heterozygotes will always fall between 2pq and 0 (1-s) HS = --------------- 2pq (1- s/2) HS = equilibrium heterozygote frequency (random + selfing) s = proportion of selfing 44?
The loss of heterozygosity through time caused by inbreeding Brother-sister (sibs) .5 .4 Selfing .3 Ht .2 .1 0 20 0 Time in generations 45-1
0.75 Full-sibs Half-sibs 0.50 Double first cousins Loss of Ht 0.25 First cousins 1 2 3 4 5 Generations 45-2
Genetic consequences of inbreeding 1) decrease in heterozygosity, no change in P (allelic diversity) (the more related the individuals, the faster the loss of H) 2) increases the probability of a zygote receiving identical alleles (homologous alleles), which will result in increased expression of recessive alleles. 3) increased phenotypic expression of deleterious alleles (strongly selected against) - often results in decreased size, reproduction, vigor, etc., which decrease fitness (i.e., inbreeding depression) 4) increase in phenotypic variability resulting from a deviation from the mean genotypes in non-inbred individuals Genetic load 43e-1
Inbreeding coefficient Sewall Wright (1923) F = the probability that an individual will receive two equal alleles, at a specific locus, that are from the same ancestor. Autozygous = identical by descent allozygous = not identical by descent F = probability that an individual will be autozygous at a given locus 1 - F = probability that an individual will be allozygous at a given locus 43e-2
Calculate Junior’s inbreeding coefficients from this pedigree: Mom Dad AB CD C = .5 C = .5 AC Sis C = .5 Junior (or could be DD from Dad) CC Probability of C from Dad to Sis to Junior = .25 Probability of C from Dad to Junior = .50 Probability of Jr. inheriting CC from Dad = .25 X .50 = .125 Probability of Junior inheriting DD from Dad = .125 F = .125 + .125 = .25 = probability of Jr. being autozygous 31