Download
1 / 38
420 likes | 710 Views
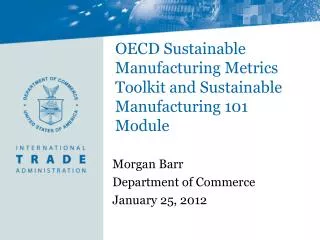
OECD Sustainable Manufacturing Metrics Toolkit and Sustainable Manufacturing 101 Module. Morgan Barr Department of Commerce January 25, 2012. What is the OECD?. The OECD is an intergovernmental organization with 30 member countries

E N D
OECD Sustainable Manufacturing Metrics Toolkit and Sustainable Manufacturing 101 Module Morgan Barr Department of Commerce January 25, 2012
What is the OECD? • The OECD is an intergovernmental organization with 30 member countries • “a setting where governments compare policy experiences, seek answers to common problems, identify good practice and coordinate domestic and international policies.” • Made up of several “Directorates” and numerous committees organized by issue with government and business representation • The OECD is one of the largest sources of international economic and social statistics and data
OECD Sustainable Manufacturing Toolkit • U.S. proposed study in 2006 in the Committee for Industry, Innovation and Entrepreneurship (CIIE) • Responding to industry demand with the goal of creating a useful toolkit for companies to help them start measuring their environmental performance • Work began in early 2008
Phase 1 Results • The report, Eco-Innovation in Industry: Enabling Green Growth, was published in January 2010 • It included chapters on: • Concept of sustainable manufacturing • Eco-innovation examples • Background on indicators for sustainable manufacturing • Measuring eco-innovation • Strategies for promoting eco-innovation
Phase 2 Results • Start-up Guide • Step by step guide on how to measure • Why measurement is important • Benefits of sustainability • Deals with issues of data availability, priorities, alternative sources of data • Making decisions • Going beyond the toolkit • Online portal • In-depth information on how to calculate the indicators (forthcoming) • Other advice and tools
Measurement Process • The quick-start guide describes a seven step process • Map impacts and set priorities • Choose indicators and understand data needs • Measure inputs used in production • Assess the operations of your facility • Evaluate your products • Understand your Results • Take action to improve your performance
Indicators Overview • 18 indicators • 54 data points • Facility level (can be aggregated) • Inputs, processes, products • Many are normalized • Can be tracked over time
Relationship With Other Metrics Sets Product | process | facility | corporation | sector | country | global Measurement unit LCA High MFA GRI Technical Detail Medium OECD Toolkit IPCC PRTRs EMAS EF Low
Inputs • I1. Non-renewable Materials Intensity • I2. Restricted Substances Intensity • I3. Recycled/Reused Content of Material Inputs
Operations • O1. Water Intensity • O2. Energy Intensity • O3. Renewable Proportion of Energy Consumed
Operations • O4. Greenhouse Gas Intensity • O5. Residuals Intensity • Mass Balance Approach
Operations • O5. Residuals Intensity • Total Waste Approach Ra = weight of releases to air Rsw = weight of releases to surface water Rl = weight of releases to land Rlf = weight of releases to landfills Td = weight of transfers to disposal Tt = weight of transfers for treatment Tr = weight of transfers to recycling Ter = weight of transfers for energy recovery Ts = weight of transfers to sewage GHGp= weight of additional GHGs produced from production process GHGo = Weight of additional GHGs produced from overhead Ce = Carbon content of direct energy use
Operations • O6. Intensity of Residual Releases to Air • O7. Intensity of Residual Releases to Water • O8. Percent of Land Occupied that is “Natural Cover”
Products • P1. Recycled/Reused Content of Products • P2. Recyclability of Products • P3. Renewable Materials Content of Products
Products • P4. Non-Renewable Materials Intensity Over Product Lifetime • P5. Restricted Substances Content of Products • P6. Energy Consumption Intensity • P7. Greenhouse Gas Emissions Intensity
Sustainable Manufacturing 101 Module • Goals: • Provide non-experts with an introduction to sustainability topics and guidance on how to begin implementing more sustainable practices • Gather information from disparate sources into one place • Can be used by people with a variety of training needs (specific sustainability topics to financing and decision making) • Connect users to more in depth sources of information
How to use this training If you haven’t yet, first start the slide show. Click the at the bottom of the screen Click on the arrows and other indicated buttons to move through the lesson. Click the house button to take you back to the beginning of the lesson Look for these icons to learn about: Advanced concepts Checklists with guidance to follow Tools and resources to pursue for help New or related terms Examples from real companies Terms to look for in the Sustainable Business Clearinghouse in order to find information and resources to help you.
Lessons Introduction to Sustainable Manufacturing Concepts The Business Case for Sustainable Manufacturing Getting Started and Understanding Your Impact Finding Opportunities for Improvement Deciding on, Financing, and Implementing Projects Foreign and Domestic Regulations
What is Sustainability? A common definition of sustainable development is that of the UN Brundtland Commission: “Sustainable development is development that meets the needs of the present without compromising the ability of future generations to meet their own needs.”1 You will also hear about the Triple Bottom Line2 This concept suggests that, in addition to its economic performance, a company must also account for and focus on its environmental and social performance to be truly sustainable. Another common way of saying this is “people, planet, profit”2 Sustainability is the intersection of these three concepts. Sustainability 1Brundtland Commission of the United Nations 2 John Elkington, Cannibals with Forks: the Triple Bottom Line of 21st Century business
How do you Implement Sustainable Manufacturing? It can be overwhelming to think about all the work that would be required to make your company more sustainable. However, there is a spectrum of efforts you can make towards sustainable manufacturing. Some involve more effort and investment than others.1 • New Technologies • Enable lower resource consumption, waste generation, emissions • New Product Design • Minimize impacts throughout product lifecycle • Housekeeping • Improvements in work practices and maintenance • Process OptimizationMaking adjustments to processes to increase efficiency • Raw Material Substitution • Shifting to more environmentally sound inputs Click on each of the boxes to learn more More Difficult Generally easier 1 “Government Strategies and Policies for Cleaner Production.” United Nations Environmental Programme and “Eco-Innovation in Industry: Enabling Green Growth” OECD
Economic Benefits: A Closer Look Sustainability can have a positive effect on a number of business areas. Click on each item to learn more. Resource and Production Costs Regulatory Compliance Costs Sales and Brand Reputation Financing and Capital Employee Hiring and Retention
Resource and Production Costs • Forty-four percent of CEOs from the Accenture survey reported that revenue growth or cost reduction was a major motivation for their sustainability efforts.1 • Sustainable manufacturing practices increase production efficiency, primarily through increased resource efficiency. Resource efficiency includes things like energy, water, and material efficiency. Increasing your resource efficiency will lower your material and input costs.2 • Sustainable manufacturing can also lower the cost of waste removal, as you produce less waste and byproducts, and reduce transportation costs through lower product weight and more efficient transportation.3 • Some Ways Sustainable Practices can Lower Production Expenses3 • Efficiency - Using fewer materials, energy, water and other inputs to produce each product. • Waste – Reducing or reusing scrap or wasted energy. Recycling materials • Substitution – Use cheaper and more sustainable materials and energy sources 1 Accenture and the United Nations Global Compact “A New Era of Sustainability: UN Global Compact-Accenture CEO Study 2010.” 2 UNEP Life Cycle Initiative “Life Cycle Management” 3 “The Sustainability Advantage.” Bob Willard.
What is Your Company’s Footprint? When beginning to think about where you should focus your efforts, it’s tempting to start with the impacts within your operations or just within your facility. But the effect of your product or service doesn’t stop at the factory gate. You need to think about the entire LifeCycleof your product, taking a cradle to grave approach from the inputs used to make your product to the impact it has when it is disposed of at the end of its life. Basic Product Life Cycle Materials and inputs Manufacturing Product Use End of Life Cradle Grave • Let’s discuss how you would think about impacts across the life cycle.
The Manufacturing and Product Life Cycle Pollution Waste Byproducts Inputs and Procurement Raw Materials Processing Manufacturing Remanufacturing Product Design Transportation and Distribution Recycling Distribution Product End-of-Life Retailing Consumer Use Click on the green boxes for more information Product Reuse Disposal
Manufacturing For each topic, you will learn: • Why it is an important sustainability issue • Important terms and concepts • An introduction to approaching the issue • Typical opportunities for improvement • Examples from real companies • A checklist to help with implementation • Search terms for the Sustainable Business Clearinghouse • Additional resources to help you Click on each of the topics to learn more Click here to learn about common manufacturing processes that often have environmental opportunities Water Energy Materials and Waste Greenhouse Gases Air Quality Packaging Buildings and Infrastructure
Basic Project Assessment Process 1 2 3 1Ohio EPA “Financial Analysis of Pollution Prevention Projects” 2 NEWMOA “Improving Your Competitive Position: Strategic and Financial Assessment of Pollution Prevention Investments
1: Types of Costs to Include in Analysis1 In order to understand how a project would affect your costs, you need to compare the full cost before and after the project. Let’s take a look at each of these costs in more detail. 1 GEMI “Finding Cost-Effective Pollution Prevention Initiatives: Incorporating Environmental Costs Into Business Decision Making” 2 NEWMOA “Improving Your Competitive Position: Strategic and Financial Assessment of Pollution Prevention Investments
Hidden Costs Types of Costs1 Costs included in Overhead aren’t allocated to specific processes or products or are allocated using a generic proxy, so they are “hidden”.It can, therefore, be difficult to determine the true costs of a specific process or product. 1 NEWMOA “Improving Your Competitive Position: Strategic and Financial Assessment of Pollution Prevention Investments
Hidden Environmental Costs • Many times, environmental costs should be allocated to a specific process, but aren’t because they are “hidden” in the overhead. In such cases, you could underestimate the costs or benefits of changing that process. • Traditionally, company decision making processes have not taken into account all environmental costs or savings. This can lead to the rejection of sustainability projects that have merit.1 Environmental Costs Typically Included in Overhead2 • Monitoring and Reporting • Waste Management and Disposal • Capital Depreciation • Employee Training • Utilities (electricity and water) • Permits and Fees • Equipment • Fines and Penalties • Equipment Cleaning • Legal support1 • Sampling and Testing1 Utilities can be a major cost, but it can be hard to allocate your utilities costs to your different processes accurately. The next lesson will give you more advice on how to do this for specific utilities. 1 GEMI “Finding Cost-Effective Pollution Prevention Initiatives: Incorporating Environmental Costs Into Business Decision Making” 2 NEWMOA “Improving Your Competitive Position: Strategic and Financial Assessment of Pollution Prevention Investments
“Hidden” Costs Example1 Welding • Imagine a facility with two processes, welding and surface coating. • Only the surface coating process uses hazardous materials and produces hazardous waste. • Overhead costs for resulting from the hazardous materials could be allocated to both processes using a proxy (such as labor hours), resulting in the costs shown in the red boxes. • In reality, the surface coating process is really responsible for the costs, resulting in the cost allocation in the blue box. • Overhead Costs: $10,000 • Hazardous Material Training • Labeling and Manifesting • Waste Disposal • Permits and Fees • Protective Gear Welding Materials Energy Surface Coating Air Emissions Coatings Solvents Energy $5,500 Hazardous Waste Solid Waste $4,500 $10,000 Result: If you were considering a project to remove all hazardous materials from surface coating, using this overhead allocation would underestimate the true benefits of the project. More accurate allocation 1 NEWMOA “Improving Your Competitive Position: Strategic and Financial Assessment of Pollution Prevention Investments
Process Costs Example • Here we see some of the potential types of costs to be included when analyzing the change to the surface coating process. • On the next slide, we will see how some of these costs would be quantified. • Initial Costs • Purchase of new equipment • Installation • Training • Hidden Costs • Cost of energy in process • Compliance costs (permitting, documentation, training, protective gear) • Waste Management • Direct or Visible Costs • Materials like coatings and solvents • Labor • Wasted materials Surface Coating Coatings Solvents Energy Hazardous Waste Solid Waste • Contingent Liability • Risk of hazmat spill • Exposure to workers • Less Tangible Costs • Employee health and safety from hazardous materials • Company reputation • Productivity increase from new process
Hypothetical Project Cost Example Initial Cost *Tradeoffs: for this project, many costs fall, but energy costs increase. You will need to decide if the tradeoffs are worth undertaking. Annual Savings So we’ve identified an initial cost of $75,500 and annual savings of $38,000. In a few slides, we will use these numbers to conduct a project profitability assessment to determine whether the project should be implemented. Adapted from: NEWMOA “Improving Your Competitive Position: Strategic and Financial Assessment of Pollution Prevention Investments, “Lean and Clean Value Stream Mapping,” Green Suppliers Network, and “The Lean and Environment Toolkit,” EPA.
2: Project Profitability Assessment There are several common ways to assess the profitability of a project.1 These methods will help you determine whether a proposed project will add economic value to the company. Click on the boxes below to learn about each type of profitability assessment. Payback Period Net Present Value (NPV) Internal Rate of Return (IRR) • These methods involve looking at the cash flow generated by your project. In the case of sustainability projects, this is usually through cost savings. The result is a single number that allows you to understand how profitable the project is. • Your company may have a method that it typically applies when analyzing investments.2 1 Ohio EPA “Financial Analysis of Pollution Prevention Projects” 2 EnergyStar Building Manual Chapter 3 Investment Analysis
Net Present Value Example • The easiest way to calculate NPV is through the use of a spreadsheet or calculator that can calculate NPV.1 • Going back to our surface coating example, let’s assume a cost of capital here of 10%, a project lifetime of 5 years, and constant annual savings. Present Value1 = Future Value (1+r)T r= discount rate T=number of periods in which interest is earned NPV = Present Value of all Cash Inflows - Present Value of Cash Outflows Positive NPV 1 NEWMOA “Improving Your Competitive Position: Strategic and Financial Assessment of Pollution Prevention Investments
Financing Environmental Investments Commercial Loans Once you’ve decided on a project, you may be able to finance it using retained earnings, but you may also need to look outside the company for financing. When considering financing for your project, it’s important to find the appropriate financing vehicle for your specific situation.1 You should consider things like the size of your company, the kind of project you need to fund, your cash flow, other financial considerations. It is important to start with a cash flow projection to help you determine whether you need to seek outside financing. It will also be required for any loan.2 Click on each of the types of financing for more information Federal or State Assistance Leasing/ Vendor Financing Utility Incentives and Rebates Equity and Venture Capital Energy Service Companies (ESCOs) Tax Incentives 1 NIST MEP “Quick Reference Guide to Growth Financing” 2 Department of Energy “Financing Options, Techniques, and Strategies”
Toolkit and Sustainable Manufacturing 101 Modules can be found at www.trade.gov/green • Contact information: • Morgan Barr, 202-482-3704, morgan.barr@trade.gov • Bill McElnea, 202-482-2831 , bill.mcelnea@trade.gov