Download

1 / 21
210 likes | 243 Views
Key Performance Indicator or KPI is a quantifiable measure used to evaluate the success of an organization. Here are key manufacturing KPIs to track.<br><br>#keyperformanceindicatior #kpi #manufacturing #manufacturingsoftware #mrpeasy #mrpsoftware #mrp #erp #mrpsystem #erpsystem

E N D
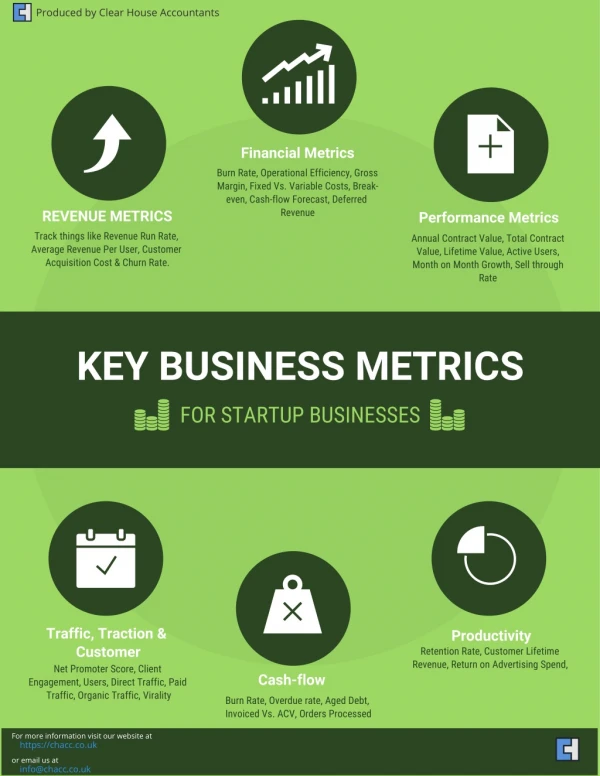
KEY MANUFACTURING BUSINESS METRICS
Key Performance Indicator or KPI is a quantifiable measure used to evaluate the success of an organization. Here are key manufacturing KPIs to track. Key performance indicators (KPIs) allow companies to effectively manage the resources available to get products. In other words, KPI management enables you to make better use of production capacity, increase productivity, improve product quality, improve delivery times, minimize waste, and control costs. We will explore into some useful KPIs that a manufacturing business may apply for performance improvement.
Overall Equipment Effectiveness (OEE) The Overall Equipment Effectiveness or OEE is a key performance indicator that enables the production centers to monitor and improve the productivity of a machine or a production line. There are many ways to determine the OEE, one of which is to break down availability, performance, and quality. The OEE has the following formula: OEE = Availability * Performance * Quality This means it measures the percentage of time that a machine or production line produces good quality articles during the scheduled time.
Let’s see an example. A machine was planned to run from 6:00 a.m. to 2:00 p.m. (8 hours) and the standard production rate is 100 units/hour. Suppose there were 30 minutes of machine downtime, and during that 8 hours 700 units were produced, for which only 640 were of adequate quality. To determine the OEE, you may proceed as follows:
Overall Equipment Effectiveness shows the value-added time and highlights the losses. The losses can be defined as the activity that does not add value to the product. There are many categories to classify the losses: 1. Machine breakdown 2. Contingencies 3. Setup time 4. Shortstops 5. Speed loss 6. Scrap or quality defect Every operational team should measure and highlight the operational losses and implement countermeasures to increase the OEE.
Work-in-process (WIP) The Work-in-process (WIP) is a key performance indicator that measures the value of raw materials or subassemblies that have entered the manufacturing process, before obtaining the finished good. There are two main groups: Waiting to be processed Being processed The WIP has the following formula: WIP = Manufacturing Lead Time * Production Flow Value
Let’s say that a work center takes 5 hours to finish a batch and the production flow rate is in average 100 kg/h at a cost of $1/kg, the WIP will be: WIP = 5 hours * (100 kg/h * 1 $/kg) = 500$ This means that there is $500 of material in that work center. Following the two main categories, it may be that this material is on any machine or waiting to be used.
Work-in-process inventory depends on the manufacturing lead time and manufacturing costs, the number of orders in process, and the batch sizes. Further analysis will be required by the operational team to determine any way of performance improvement. Among others, such improvement may result in: reduction of the manufacturing cost reduction of the manufacturing lead time optimization of the batch sizes optimization of the labor increase of space in the shop-floor enhancement of the transition between the work centers • • • • • •
Lead Time (LT) The Lead Time or LT is the key performance indicator that measures the time that takes to perform a process. It can be: Manufacturing Lead Time, which is the total time that a production center requires to manufacture a product. Delivery lead time, which is the time taken to deliver a finished product to the customer. Total lead time, which is the time from when an organization receives an order till the delivery of the order to the customer. • • •
Lead Time (LT) To shorten the lead times, every manufacturing business uses different manufacturing strategies, depending on the type of product they manufacture: Make to Stock Assemble-to-order Make to Order Engineering to Order • • • •
Lead Time (LT) The differences between themselves depend on The nature of the items (standard or customized) The nature of the equipment (specific machinery or general-purpose machinery) The nature of the process (design, manufacture, assemble, etc.) • • • And the type of production system the organization has Flow System, for example, a refinery. Bath Manufacturing, for example, when producing metal spare parts. Fixed Position System, for example, when building a skyscraper. • • •
On-time-in-full (OTIF) The On Time in Full or OTIF is the key performance indicator that measures the amount of orders which had been delivered with the right quality and the right quantity on time to the customer. To get the shape of a ratio, it is compared to the total amount of orders. The OTIF has the following formula:
On-time-in-full (OTIF) Let’s assume that an organization has currently 100 orders for delivery today, but: 4 orders have not reached the quantity required by the customer 3 orders exceed the quantity required by the customer 2 orders contain defective products 1 order arrived late Then the OTIF on that day will be: • • • •
On-time-in-full (OTIF) Finally, we can say that the On Time in Full is a strict KPI that measures the service level of an organization and it involves many functions (commercial, logistics, production, purchasing, etc.). On the other hand, it is necessary that every organization defines the tolerances involved with the product defects, quantities per order, and late arrival. By breaking down the losses, it can highlight: Delays within the supply chain Product defects Shipments with different quantities to the sales order • • •
Cost per unit (CPU) The cost per unit (CPU) is a powerful key performance indicator that helps a manufacturing system to optimize the cost of the products. It also helps to offer competitive prices in the market, and also increase the profit of the company. The CPU has the following formula: In which, To give a simple example, let’s assume an organization that manufactures 1000 units of a product with the following cost breakdown: Direct Material – $3000 Direct labor – $2000 Manufacturing Overhead (MOH) – $1000 • • •
Cost per unit (CPU) There are different methodologies to allocate Manufacturing Overhead when a company produces a mix of products. The methodologies can be standard cost, direct cost, activity- based cost, etc. It is very important to define the correct allocation methodology. It will help to define how profitable or not a product is and set the price by adding the markup to the total product cost.
Cost per unit (CPU) In any case, every KPI follows an iterative process to improve and reach business goals, as follows: Measure the KPI Break down the KPI into categories Sort the categories with a higher percentage of losses, for example by using Pareto charts Find the root cause of the problem Implement countermeasures for problem-solving Re-measure the KPI as an iterative process. As an additional consideration, note that some of the terms used to define each KPI in this article may vary depending on the author and the particular use within each organization.
https://manufacturing-software-blog.mrpeasy.com/key-manufacturing-https://manufacturing-software-blog.mrpeasy.com/key-manufacturing- business-metrics/ https://www.mrpeasy.com/