In-Line Characterization of PP/Clay Nanocomposites Using NIR Spectroscopy
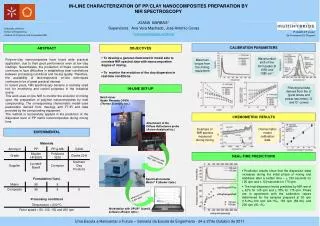
This study explores the in-line characterization of polypropylene/clay nanocomposites through near-infrared (NIR) spectroscopy. The research investigates the rheological properties and dispersion states during mixing, with data collected using a Haake Rheomix OS600. Results demonstrate that the dispersion state improves during the initial mixing phase, stabilizing within approximately 180 seconds at 125 rpm and 120 seconds at 175 rpm. Final dispersion rates were predicted at ±42% and ±78%, aligning with calibration values across various mixing speeds.

In-Line Characterization of PP/Clay Nanocomposites Using NIR Spectroscopy
E N D
Presentation Transcript
IN-LINE CHARACTERIZATION OF PP/CLAY NANOCOMPOSITES PREPARATION BY NIR SPECTROSCOPY JOANA BARBAS* Supervisors: Ana Vera Machado, José António Covas * joana.barbas@dep.uminho.pt • IP 026685-2IP project • 6th Framework EC Program Wavenumber shift of the Si-O peaks at 1050 and 1080 cm-1 Maximum torque from the mixing equipment Rheological data derived from the η* (yield stress and power law index), G’ and G’’ curves Batch mixer Haake Rheomix OS600 (Thermo Scientific Inc.) Attachment of the Diffuse Reflectance probe (Axiom Analytical Inc.) Example of NIR spectra measured during mixing Chemometric model calibration data connection with fiber optic cables • Prediction results show that the dispersion stateincreases during the initial phase of mixing and stabilizes after a certain time – ± 180 seconds for 125 rpm and ± 120 seconds for 175 rpm. • The final dispersion levelspredicted by NIR are of ± 42% for 125 rpm and ± 78% for 175 rpm. These are in agreement with the calibration values determined for the samples prepared at 50 rpm (15.4%),100 rpm (24.1%), 150 rpm (58.4%) and 200 rpm (90.1%). Spectrophotometer Matrix®F (Bruker Opts.) ethernet connection (LAN wire) Workstation with OPUS® Quant2 software (Bruker Opts.)