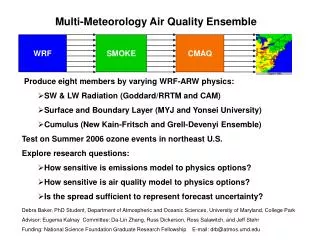
WRF Modelling
WRF Modelling. Aim: 18 th -19 th April 2010 - Cyclone taking dust SW as opposed to SE 15 th – 16 th North Scotland hit Cyclone has moved north dragging dust into the Atlantic Follow the dust track and predict landfall. How am I going to do this?

WRF Modelling
E N D
Presentation Transcript
WRF Modelling • Aim: • 18th -19th April 2010 - Cyclone taking dust SW as opposed to SE • 15th – 16th North Scotland hit • Cyclone has moved north dragging dust into the Atlantic • Follow the dust track and predict landfall • How am I going to do this? • Create plots showing sea level pressure, surface air temperature and horizontal wind vectors to show the situation at the time • Create plots showing trajectories at different height levels • Compare both of these to satellite images to check accuracy
WRF pre-processing • Namelist.wps • Start date: 00:00 18th April 2010 to 00:00 20th April 2010 • Model output every 6 hours • Domains = 2 • Outer domain - 100X100 grid points, each grid point =15km • Inner domain - 100X100 grid points, each grid point =5km (parent grid ratio =3) • Inner domain - 44i and 18j start in domain 1 • Reference point – In outer domain, 40i and 53.3j point is lat lon (61.0, -11.0) • Crib sheet: • Linked Vtable and grib files to namelist.wps • Ungribbed the files and ran them with metgrid.exe • Ran real.exe to set up boundaries • Ran ./run_wrf to get wrf.out
RIP4 • Crib sheet: • Export – told computer where to look for RIP4 associates • Moved output files from WRFV3 to RIP4 directory • Ran RIP4 to prep the data files for the model run • Output • Ran./rip to make the plots for domain 1 and 2 • Converted files to pdf
DOMAIN 1: Satellite image 19/4 at 13:00 and model output for same time
DOMAIN 2:Satellite image 19/4 at 13:00 and model output for same time
Trajectories • Rip_traj.in– changed related parameters to match namelist.wps such as: • Ptimes= 0-48 hours • Ptimesunits=h • xjtraj=12 • yjtraj=75 (location in my domain of the volcano - start place for the trajectories) • zktraj=1.0 to 4.5 in intervals of 0.5km (heights of trajectories) • For consistency, xjtraj and yitraj had 8 values, as there was 8 heights of zktraj. • Rip_traj_1.in matches rip_traj_2.in • Crib Sheet • The produced plots using ./rip and converted them to pdf
Plots • Trajectory 6 = 3.5km up • Model predicts dust will hit North Scotland at 0100UTC on 19/4/2010