Enhancing Ocean Forecasting in Australia: The Bluelink Initiative
260 likes | 384 Views
The Bluelink Initiative is a collaborative effort involving the Bureau of Meteorology, CSIRO, and the Royal Australian Navy to improve ocean forecasting. With models like OFAM and data assimilation systems such as BODAS and BRAN, this program aims to provide accurate ocean forecasts and analyses around Australia. Key advancements include high-resolution regional analysis and the assimilation of diverse sea-level and temperature observations. This initiative is crucial for understanding ocean circulation and supporting applications like marine ecosystem management.

Enhancing Ocean Forecasting in Australia: The Bluelink Initiative
E N D
Presentation Transcript
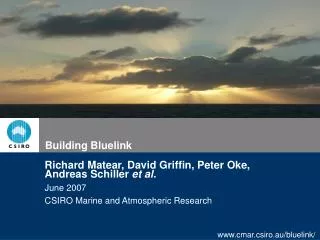
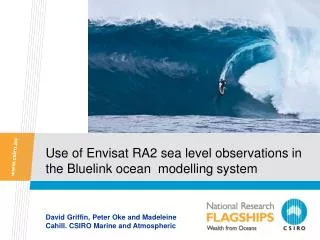
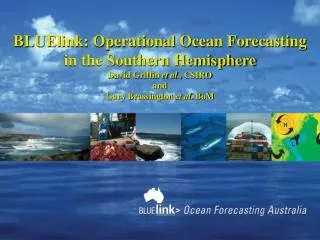
Building Bluelink David Griffin, Peter Oke, Andreas Schiller et al. March 2007 CSIRO Marine and Atmospheric Research
Introduction • Bluelink: a partnership between the • Bureau of Meteorology, CSIRO and • the Royal Australian Navy
Introduction • Bluelink: a partnership between the • Bureau of Meteorology, CSIRO and • the Royal Australian Navy • Talk Outline • Ocean Forecasting Australia Model, OFAM • Bluelink Ocean Data Assimilation System, BODAS • Bluelink ReANalysis, BRAN • Bluelink High-Resolution Regional Analysis HRRA
HRRA - Gridded altimetry and SST,statistically projected to depth:
Minimum resolution: ~100km ~10km resolution Ocean Forecasting Australia Model, OFAM • Global configuration of MOM4 • Eddy-resolving around Australia • 10 m vertical resolution to 200 m, then coarser • Surface fluxes from ECMWF (for reanalyses) … every 10th grid point shown
Bluelink Ocean Data Assimilation System, BODAS • Multivariate assimilation system: • sea level obs correct h,T,S,U,V Single point assimilation …
-> need both SST and SLA. Plan view of sea-level increments Cross-section of temperature bkgnd (grey) & analysis (black-colour)
Conclusion • BRAN1.0 plenty of lessons learnt • BRAN2.1 realistically reproduces the 3-d time-varying mesoscale ocean circulation around Australia • We are working on ways of assimilating the data tighter without introducing spurious features.
An application: dispersal of the larvaeof Southern Rock Lobster
Bluelink ReANalysis, BRAN • BRAN1.5: • 1/2003 – 6/2006 • Forced with ECMWF forecast fluxes • Assimilates observations once per week • Assimilates SLA from Jason, Envisat and GFO (T/P with-held) • Assimilates AMSRE SST • Assimilates T and S from Argo and ENACT database
BRAN1.5 vs TAO ADCP zonal currents 165E 170W 147E 140W 110W
ANALYSIS 0-DAY FORECAST 7-DAY FORECAST BRAN1.5 vs CLS 1/3o GSLA
Comparisons with with-held T/P altimetry (top) and AMSRE (bottom) Comparisons between BRAN1.5 and with-held T/P altimetry: RMS error of 8-10 cm anomaly correlations of 0.6 Comparisons between BRAN1.5 and AMSRE (every 7th day is assimilated): RMS error of 0.7o anomaly correlations of 0.7
Observing System Experiments Experiment design • With-hold each component of the observing system • 6-month integration (1st half of 2003) • compare to with-held observations • treat BRAN1.5, with all observations assimilated, as the “truth”
Assimilation of Argo and SST reduces the forecast error of SLA by ~50% compared to the assimilation of altimetry Assimilation of Altimetry and Argo only reduces the forecast error of SST by a small amount Observing System Experiments 2003
Observing System Experiments Metric • Depth average (0-1000 m) of the RMS “error” in potential temperature For the 2003 - GOOS: each component of the GOOS has a unique and important contribution to the forecast skill of upper ocean temperature each component has comparable impact on the forecast skill of the upper ocean temperature