Download
1 / 30
300 likes | 312 Views
Learn about the importance of wetlands and the harmful effects of exurban development on both wildlife and humans. Explore a case study in MacClenny, Florida and use My.World GIS to minimize development on wetland areas while accommodating the needs of exurban growth.

E N D
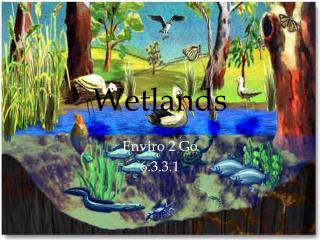
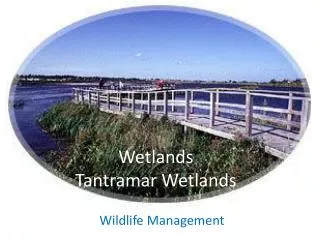
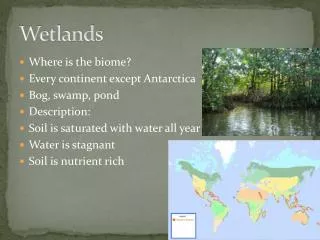
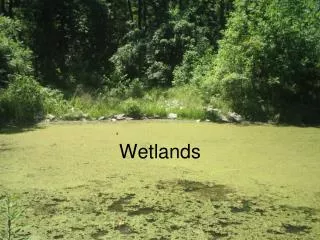
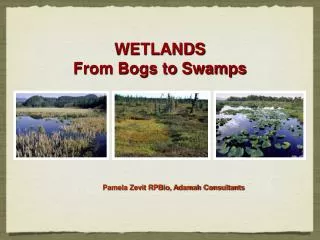
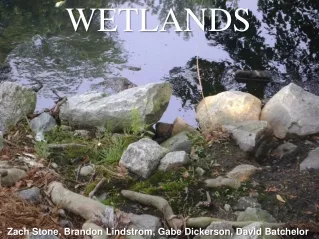
Introduction:Wetlands and its Importance • Vegetated areas saturated with surface or ground water • Important services for humans and wildlife: • Protects and renews water quality • Provides habitats to maintain biodiversity • Stores floodwaters • Protects against erosion • Recreation
Problem • Wetland loss has been increasing in the last decade due to exurban development • Thesis: The deterioration of wetlands will have harmful effects on both natural wildlife species and on humans due to the loss of wetland services. • Therefore, we must refrain from harming wetlands as much as possible.
Case Study • Wetlands are being destroyed for human exurban growth and profit at high rates, especially in Southeastern U.S. • We will act as land-use planners near the town of MacClenny in Baker County, Florida to try to accommodate people’s needs to expand to exurban areas and to protect wetlands. • MacClenny is experiencing urban sprawl from neighboring Jacksonville, Florida • Use My World GIS to determine the best location for issuing a 25-acre development permit
Criteria • Minimize development on wetland areas as much as possible • Minimize land use impact • Make the development close to existing transportation and infrastructure • Within the area defined by the Valdosta Land Use layer. • No closer than 100 meters of any wetland. • Not in an area already listed as residential or urban. Preferably in an area that only requires re-zoning. • Within a 15 km distance of Interstate 10. • Within 5 km of any other access road • Near to areas defined as higher income • Within 100 km of MacClenny, Florida
How to Use My World GIS • Download the software and the Wetlands data from the site and launch the program. • The right side should be blank when opening it. • Then FILE OPEN PROJECT WETLANDS.m3vz file • A world map should now appear with some layers at the left side.
Explore Buttons and Tabs • Activating Layers: • A layer is active if it is white colored or highlighted with a yellow border, and when the box in the upper right has an eye in it. • Zoom and Navigation: • ± Magnifying Glass buttons: allow you to zoom in or out by clicking the area on the map (above the world map on the left) • Zoom to Selection: the map will zoom to the extent of the layer activated (4 arrows pointing inward above the left side map) • Zoom to All: takes the map all the way back out to full view (4 arrows pointing outwards above the left side map) • Grabby hands button: allows you to move the map and put different areas into view (fourth button on the toolbar)
How to Make Layers • Click on Analyze tab List of options that allows you to make different types of layers, such as buffers. • To make a buffer Select Make Buffer Around • You can make a buffer around anything that’s on the map, such as around a city and set the distance from what ‘s selected. • By Value Selection under the Menu makes a layer when you select downloaded records (i.e. can choose certain areas of the data that will be made into a layer) • Checking the box saying Make Selection New Layer will make a new layer of the data selected.
How to Edit Layers • You can edit the appearance of the layers by selecting the tabs the at the top: • Select Layer Edit Layer Appearance • Change the fill color/ outline color/ outline width/ dot density / transparency of the layer. • Edit the name of the layer.
Analyze Tab • We mainly used the By Value selection and the Make Buffer Around option
Data From the website, we downloaded the Wetlands file for My World GIS and the Land Use and Land Cover Data for Baker County, Florida. We obtained data called Land Use Valdosta (a layer) that allowed us to see the different biomes and geographical features of the area. With this, we were able to locate the wetlands around MacClenny. Also, there was a map of the topography of MacClenny, which allowed us to see aspects not shown in the layers of My World GIS, such as smaller roads.
The Three Buffer Zones (cont.) • Within 15km of Florida’s Interstate 10 (Light yellow) • Within 100km MacClenny, Florida (Gray circle) • 100 meters away from the wetland areas (Purple)
How to Designate the Development Sites Switch from Visualize mode to the Edit tab. Click on the button in the upper left corner: Create New, Empty Layer, and a pop up will appear. From the pop up, select Polygons and name it Proposed Development and Create Layer. Next, choose the Polygon tool in the toolbar above the map and use it to draw a polygon of the area of the sites. Each click of the mouse will make a vertex of the polygon. Double click when you are done drawing the polygon.
Designating Developments (Continued) After drawing the polygon of the areas, you have to find out what the area of the region you sectioned off is. To do so, return back to the Visualize tab and activate the layer of the site. Then, click on the button of the table of the layer, showing you the area of the site in meter squared (100,000 square meters is about 25 acres) You can also edit the border lines of the polygon by clicking on Edit Appearance of Layer button.
Why did we choose these sites? • They fit all the criteria that we were given: within the three buffers and at a decent distance from MacClenny. • The red polygons represent a general land area that can be used to develop within these requirements • Within the red polygons, we chose three possible 25-acre development area close to MacClenny. • The red polygon on the left of MacClenny was chosen because it was closer to the town. • The red polygon on the right of MacClenny was chosen because its average income is higher than the first polygon area. However, this site is also further away from MacClenny. • We chose 2 sites from the right red polygon because it fits the criterion of a higher average income as well as the other criteria. We only chose 1 site from the left red polygon because it has a lower average income.
Let’s pretend we choose a site to develop an exurban community
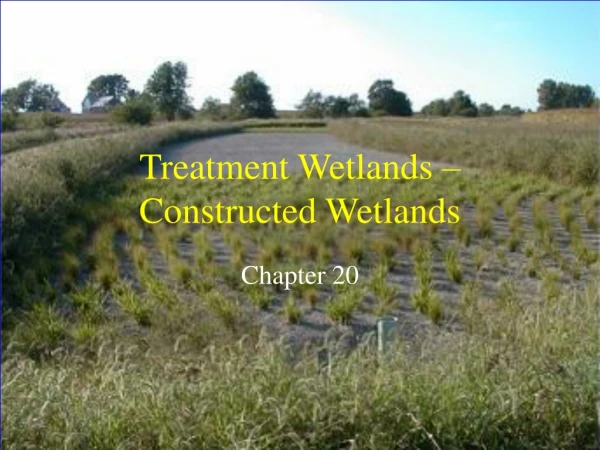
Another Case Study: Constructing a New Sewage Treatment Plant • The new exurban development requires a sewage treatment plant to manage the increased amount of human wastes. • This new treatment plant may have to be built near wetlands due to a lack of available land area. • The goal is to choose a site that is relatively far away from development, near a site of disposal, and does not disturb neighboring wetlands.
Factors to Consider: Choosing a Sewage Treatment Site • Distance from wetlands: sewage treatment plant discharge will not harm wetlands • Distance from development can’t be too large because of the pipelines needed to connect the residential area to the sewage plant
Analysis of Sewage Treatment Plant Locations • There are few available sites for building the sewage treatment plants due to the restrictions. • Distance – We tried to make the sewage plants as close to the selected exurban areas as possible, while keeping them relatively far away from the wetlands. • Possible Sewage Discharge Areas – Since sewage discharge needs to be empty into nearby body of water, the proposed sewage plant should be closer to the river so there is lesser risk that the waste will spill out before reaching the river and less resources used on building pipes
Conclusion:Implications and Lessons • Implications: • Land use planning will become increasingly important as the human population continues to rise exponentially • Important to take into account both environmental and economic aspects in land use planning • Lessons: • How to use My World GIS for land use planning • Using existing data to solve case studies
Bibliography • "Clean Water - Environment Florida." Home - Environment Florida. Web. 08 June 2011. <http://www.environmentflorida.org/clean-water2>. • My World GIS :: My World GIS. Web. 01 June 2011. <http://www.myworldgis.org/>. • "Protecting Wetlands from Exurban Development." SERC. Web. 01 June 2011. <http://serc.carleton.edu/eet/wetlanddev/index.html>. • "Vanishing Wetlands: A Magic Act?: Introduction." QuestGarden.com. Web. 08 June 2011. <http://questgarden.com/68/07/4/080708102144/>. • "Wetlands | Wetlands | US EPA." Index | Water | US EPA. Web. 02 June 2011. <http://water.epa.gov/type/wetlands/index.cfm>.