Download

1 / 10
100 likes | 157 Views
Learn how to find a 5-number summary, percentiles, and create box-and-whisker plots to visualize data distribution. Discover outliers and analyze test scores efficiently.

E N D
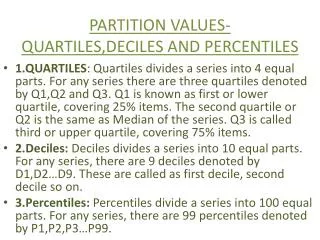
5 Number Summary To Find a 5 Number Summary: • Put the numbers in order from least to greatest • Determine the max and the min • Find the median. • Take all numbers to the left of the median, find the median of these numbers, that’s Q1(1st or lower quartile) • Take all numbers to the right of the median, find the median of these numbers, that’s Q3 (3rd or upper quartile)
5 Number Summary 43, 68, 73, 78, 80, 88, 92, 52, 70, 74, 78, 82 • 43, 52, 68, 70, 73, 74, 78, 78, 80, 82, 88, 92 • Min = 43; Max = 92 • Median = 76 • Q1 = 69 • Q3 = 81
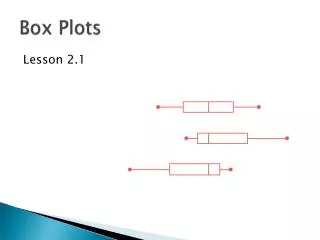
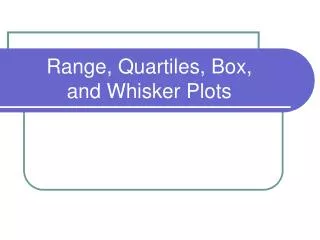
Box and Whisker Plots (A visual of the 5-number summary) Steps to create Box and Whisker: • Draw a number line that includes the max and min • Draw vertical segments at 1st, 2nd, and 3rd, quartiles • Connect them to form a rectangle (this is the box) • Draw horizontal segments (whiskers) to connect to max and min
40 50 60 70 80 90 Box and Whisker Plots Steps to create Box and Whisker: • Draw a number line that includes the max and min • Draw vertical segments at 1st, 2nd, and 3rd, quartiles • Connect them to form a rectangle (this is the box) • Draw horizontal segments (whiskers) to connect to max and min 43, 52, 68, 70, 73, 74, 78, 78, 80, 82, 88, 92 Min = 43; Max = 92 Median = 76 Q1 = 69 Q3 = 81
Percentile • The pth percentile of a set of numbers is the value such that p percent of the numbers are less than or equal to that value {43, 52, 68, 70, 73, 74, 78, 78, 80, 82, 88, 92} a) Find the percentile rank of the score of 78 • There are 12 total numbers • There are 8 numbers less than or equal to 78 • 8 / 12 = .67, so 78 is the 67th percentile. b) Find the score with the 75th percentile rank. 75% of 12 is 9, so the 9th piece of data in the set is the score of 80.
43, 52, 68, 70, 73, 74, 78, 78, 80, 82, 88, 92 • What number is at 20th percentile? • 20% of 12 is (0.2)(12)=2.4 • There is no integer at 2.4th spot. We usually round up to the next integer. The 3rd integer which is 68 is the number at the 20th percentile.
Finding Outliers (Pieces of data that affect the Mean) Steps to finding Outliers: • Find the Inter Quartile Range (IQR): Q3-Q1 • Add 1.5 x IQR to Q3. Any piece of data above that number is an outlier. • Subtract 1.5 x IQR from Q1. Any piece of data below that number is an outlier.
Finding Outliers Steps to finding Outliers: • Find the Inter Quartile Range (IQR): Q3-Q1 • Add 1.5 x IQR to Q3. Any piece of data above that number is an outlier. • Subtract 1.5 x IQR from Q1. Any piece of data below that number is an outlier. 43, 52, 68, 70, 73, 74, 78, 78, 80, 82, 88, 92 Q1 = 69 Q3 = 81 • IQR = 81-69 = 12 • 1.5 x 12 = 18 + 81= 99. Since there are no pieces of data above 99, there are no outliers at this end. • 69 -18 = 51. Since the score of 43 is below 51, it is an outlier.
Example • 43 68 73 78 80 88 92 • 52 70 74 78 82 89 93 • 65 70 75 78 85 90 94 • 66 71 75 78 87 90 94 • 67 72 76 79 87 90 98 Find the 5-number summary Find the percentile rank of 89 What test score is at the 20th percentile?