Download

1 / 28
280 likes | 298 Views
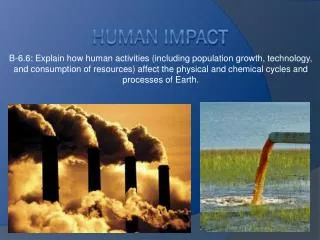
Explore the historical, geographical, and demographic aspects of the human population, including migration patterns, urbanization, and distribution. Understand how factors such as fertility, longevity, and migration impact population growth. Learn about significant global migrations like the European Migration and how it shaped population distribution. Analyze population growth rates and regional demographics, including North America's population history.

E N D
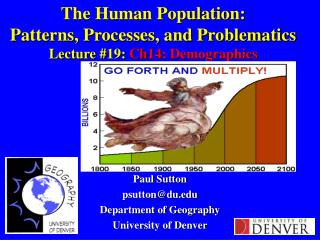
The Human Population:Patterns, Processes, and ProblematicsLecture #2 Paul Sutton psutton@du.edu Department of Geography University of Denver
How many Humans have ever lived? In 1980 William Matthews claimed that there were more people alive on the planet than had lived and died on it. Could this be true? (In short… NO) Nathan Keyfitz did the most systematic study. His conclusion: 60 billion have been born. Today’s 6 billion represent about 10% of all humans born ever. How does one calculate this? Estimates of fertility, longevity, infant mortality, and their changes through time are necessary. It is interesting to note that we represent a much higher fraction of adults that have lived on the planet.
Historically humans have typically migrated from growing, densely populated areas to vacant or less densely populated areas. Example: The European Expansion Today, Economic opportunities are a major driving force of human migration. Examples: Mexican migration to United States and Rural to Urban migration globally Redistribution of Population through migration
The European Migration (1500-1950) Although the continent was already crowded, the death rate began To drop and the population began to expand rapidly. Simultaneous Urbanization, new occupations, financial panics, and unrestrained Competition gave rise to status instability on a scale never known Before. Many a bruised or disappointed European was ready to Seek his fortune abroad, particularly since the new lands, tamed by The Pioneers, no longer seemed wild and remote but rather like Paradises where one could own land and start a new life. The Invention of the steam ship (the first one crossed the Atlantic in 1827) Made the decision less irrevocable. [Kingsley Davis]
Population Proportions before and after the European Expansion - 18% of world pop European (90% of them in Europe) 1930’s – Peak of Euro Domination. 35 % of World European 2000 - People of European ancestry are 16% of World pop By 2050 – People of European ancestry will only be 11% Pre WWII: Developed countries had growing populations and out-migration After WWII: Developing countries had growing populations and out-migration “Population growth used to be a reward for doing well; now it’s a scourge for doing badly” [Judith Blake]
The Urban Revolution • For most of human history people lived rural areas • In 1800 1% of world urban, 10% of England urban • Trade and Industrialization caused urbanization • Rome’s population of 650,000 in 100 a.d. unusual • Today the world is just about 50 % urban • The United States is about 75% urban • Some countries like Venezuela are 90% urban • The world is still urbanizing and is expected to settle at about 75% urban eventually
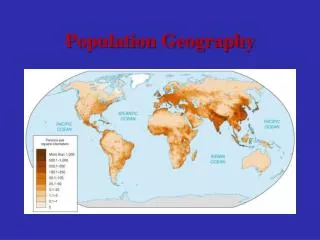
Geographic Distribution of World Population The world’s 10 most populous nations constitute 59% of the world’s population and 37% of the world’s land area. • China 1.3 Billion • India 1.1 Billion • United States 281 million (note book’s estimate of 275) • Indonesia 219 million • Brazil 174 million Note: there are more • Russia 146 million people in China than • Pakistan 141 million in the U.S., Indonesia, • Bangladesh 132 million Brazil, Russia, Pakistan • Japan 126 million Bangladesh, Japan, and • Nigeria 117 million Nigeria combined. China (and India to some extent) are the major demographic drivers on the planet. This is one of the reasons why you hear so much about China joining the WTO and Sino-US relations
Three ways of Mapping the Global Population • A Nighttime Satellite Image • A Cartogram where Area of Nation ~ Population • 3) Choropleth Map (Color ~ Total population • What benefits and/or drawback do each map have?
Nighttime Satellite Image of EarthProduced from Defense Meteorological Satellite Program
Cartogram of World Population Why do people often think Africa is overpopulated?
This is a map of World Population density How is this different than the other maps? Do you like it better?
Geographical Variation in Population Growth Rates Global Growth Rate 2000 is 1.25% per year (doubles in 55 years) Some countries growing much faster: most of the Middle East nations most African nations, much of Latin America, and the Indian subcontinent Some countries are growing more slowly: The United States, Brazil, China, Australia, Canada, Chile, and Japan Some countries are actually shrinking: Much of Eastern Europe, Spain, and Italy
Regional Demographics: North America IU.S. and Canada ~ 5% of World Population • U.S. ~ 281 million • Canada ~33 million • Mexico ~ 100 million • In 1650 there were about 3 million Native Americans and 50,000 Europeans in what is now U.S. and Canada • By 1850 Guns, Germs, and Steel had reduced Native American population to 250,000 and European numbers had grown to 25 million. Population Density of North America today
Regional Demographics: United States • Colonial America: Really high fertility rates (8-9 children per woman in North, much lower in South) • Most growth from natural increase. (immigration only about 3% of it) • Migration not a major source of U.S. population growth until 1850 • Almost a population decline during depression • Post WWII ‘Baby Boom’
Regional Demographics:Canada • Canada originally settled by the French • Ceded to England in 1763 • History of French vs. English Rivalry • French speaking Canadians (mostly in Quebec) Of total population: 28 % in 1931 24% in 1997 • Today Canadian fertility ~ 1.6 children / woman • Nonetheless population growing from immigration • U.S. and Canada two of the most immigrant-friendly countries in the world
Regional Demographics:Mexico & Central America • Millions of people in Central America prior to Columbus (way more than in North America) • Aztec and remnants of Mayan civilization quite sophisticated with agriculture and other cornerstones of complex civilization • Colonized by Spanish with different goals: ‘take the gold and run away”. • Population decimated by disease • Very high population growth since WWII due to dropping death rates
Mexico & Central America Today~2 % of Total World Population • Mexico ~ 100 Million • Guatemala, Honduras, El Salvador, Nicaragua, Costa Rica, Panama, & Belize ~ 35 Million • TFR in Mexico around 6 from 1600 to 1970 • Drops to 3.5 by 1995 • 10% of Mexican citizens live in U.S. today. • Any connections between those facts?
Regional Demographics:South America • South America ~330 million • About 5 % of World Total • (A little over half of them in Brazil) • Brazil colonized by Portuguese – 1/3 of slaves in slave trade ended up in Brazil. Today the people of Brazil are Half European ancestry, Half Native or African ancestry. • TFR Brazil 6 in 1960 2.3 today (a dramatic demographic change) • In general: Greater European influence, greater economic development, lower TFR Population density of South America
Regional Demographics:Europe • Europe ~730 million • Russia, Germany, United Kingdom, France, Italy (top 5) • Western Europe growing slowly thanks to immigration • Eastern & Central Europe actually depopulating • Catholic countries of Spain & Italy with VERY low fertility rates.
Regional Demographics:North Africa & Western Asia • Total Population of the Middle East and Maghreb ~350 million (6% world) • Islam the predominant religion in the region • A cluster of nation with unusually high population growth rates. Population Density in the Middle East North African Countries aka The Maghreb Algeria, Libya, Morrocco, Mauritania, Tunisia
Regional Demographics:Sub-Saharan Africa • Sub-Saharan Africa ~650 million (11% world) • 1, 2, 3: Nigeria, Ethiopia, Zaire • Many of the most population challenged countries of the world are in Sub-Saharan Africa • AIDS will not keep population from growing, will slow growth rate though • ~11 million Africans forcibly relocated to Western Hemisphere from Slave Trade from 1600-1900 • Lower Death rates since WWII cause of population growth. • Birth rates remain high throughout much of Africa Population Density of Africa south of the Sahara
Regional Demographics:East Asia (China, Japan, N & S Korea) • East Asia ~1.5 Billion(25% of World Population) • China ~1.2 billion • Japan ~125 million • 1850 1 in 3 living people were Chinese • Today 1 in 4 living people are Chinese • TFR in China today 1.9 • TFR in Japan today 1.5 • Ironically China is trying to get their TFR down to 1 whereas Japan would like to raise theirs to over 2 Population Density in Eastern China, Japan, and Koreas
Regional Demographics:South & Southeast Asia • S & SE Asia ~2 Billion (1/3 of World Population) • India ~ 1 Billion (expected to pass China in total pop size soon due to higher fertility rate) • Fertility highly variable throughout India with notable low levels in Kerala and Tamil Nadu • Pakistan & Bangladesh Muslim whereas India primarily Hindu • Indonesia is 4th most populous nation in the world (behind China, India, and United States) with 219 million (also the nation with largest Muslim population) Population density of the Indian Sub-continent
Regional Demographics: Oceania Oceania is sometimes referred to as “Overseas European” Total Population ~30 million Australia 20 million Papua-New Guinea and New Zealand Small populations scattered around on Islands.
Next Time……….. • Tomorrow we meet in Boettcher West 126 • Chapter 2: Demographic Resources • What is a census? How is it conducted? • What kinds of errors are there and how big are they?