Analyzing Power Amplifier Characteristics: Graphs and Waveforms
This document provides a comprehensive analysis of the performance metrics for a power amplifier rated at 1 kW. It includes detailed graphs of output voltage (Vout) and drain current (ID) versus input voltage (Vin), along with plots of ID against gate-source voltage (VGS) and the square root of ID versus VGS. Further sections explore the output resistance dependent on Vout, showing ID correlations, and present key parameters like threshold voltage (Vth) and minimum voltage (Vmin). Additionally, waveform images illustrate the amplifier's response over time.

Analyzing Power Amplifier Characteristics: Graphs and Waveforms
E N D
Presentation Transcript
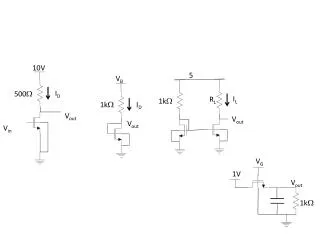
10V VB 5 ID 500W 1kW ID IL RL 1kW Vout Vout Vout Vin VG 1V Vout 1kW
Part 1 • Graphs of Vout and ID vs. Vin go here 10V ID 500W Vout Vin gm=
Part 2 Plot of ID vs. VGS goes here VB Plot of sqrt(ID) vs. VGS goes here 1kW ID VGS • ½mnCoxW/L= Vth =
Part 3 5 IL RL 1kW Vout ro = ID vs. Vout PLOT GOES HERE Vmin =
VG 1V Vout 1uF 10kW Part 4 Picture of rising/ falling waveform goes here. Plot of RDS,ON vs. VG goes here.