
Abstract
Evaluation of T errain D atasets for LiDAR data thinning and DEM generation for watershed delineation applications.

Abstract
E N D
Presentation Transcript
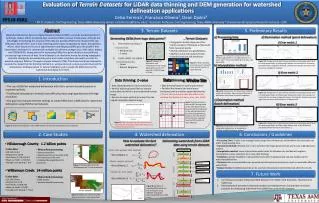
Evaluation of Terrain Datasets for LiDAR data thinning and DEM generation for watershed delineation applications • Celso Ferreira¹, Francisco Olivera², Dean Djokic³ ¹ PH.D. Student, Civil Engineering, Texas A&M University (email: celsoferreira@tamu.edu) ² Associate Professor, Civil Engineering, Texas A&M University ³ Environmental Systems Research Institute - ESRI EP51D-0582 Abstract 3. Terrain Datasets 5. Preliminary Results Watershed delineation based on Digital Elevation Models (DEM) is currently standard practice in hydrologic studies. Efforts to develop high-resolution DEMs continue to take place, although the advantages of increasing the accuracy of the data are partially offset by the increased file size, difficulty to handle them, slow screen rendering and increase computational needs. Among these efforts, those based on the use of Light Detection and Ranging (LiDAR) pose the problem that interpolation techniques in commercially available GIS software packages (e.g., IDW, Spline, Kriging and TOPORASTER, among others) for developing DEMs from point elevations have difficulty processing large amounts of data. Terrain Dataset is an alternative format for storing topographic data that intelligently decimates data points and creates simplified, yet equally accurate for practical purposes, DEMs or Triangular Irregular Networks (TIN). This study uses terrain datasets to evaluate the impact that the thinning method (i.e., window size and z-value), pyramid level and the interpolation technique (linear or natural neighbor) used to create the DEMs have on the watersheds delineated from them. a) Processing time d) Decimation method (point delineation) …Terrain Datasets Generating DEMs from huge data points? • Designed to handle large point files. • Multi-resolution TIN-based surface build from measured points. • Stored as features in a geodatabase. • Ability to work with pyramid levels. • Includes hard and soft breaklines. I) Error metric 1 Too many points ? a) b) c) • DECIMATION • Window Size • Z-value Figure9: Processing time comparison for the Hillsborough dataset (~2.2 billion points) on a Intel® Core™ 2 Duo CPU E8500 @ 3.16 GHz, 2.00 GB of RAM 2. Cells with no data ? Figure 4: Example of decimation and interpolation areas using a Raster grid cell size of 5 feet and a LiDAR dataset of 3 feet. Figure 12: Comparison of data thinning methods increasing pyramids level for study watersheds: a) Hillsborough dataset was sensitive for increasing pyramids levels using both methods; and b) Austin dataset presented very low errors using both methods. • INTERPOLATION Figure 5: Terrain datasets overview (source: adapted from the ESRI ArcGIS 9.3 Users Manual). • Linear • Natural Neighbors b) Interpolation method II) Error metric 2 a) b) c) 1. Introduction Data thinning: Z-value Data thinning: Window Size • Data thinning based on spatial parameters. • Partition the domain into equal areas (windows) with pre-define spatial dimensions. • One or two points are selected within each window size based on (mean, max, min, both). • Data thinning based on vertical accuracy. • Vertical tolerance based filter to remove points that are within a pre-established vertical range. • Assures a known vertical accuracy from the original data after data-thinning. • The use of DEM for watershed delineation with GIS is current standard practice in engineering fields. • Traditional interpolation methods have difficulty processing large datasets with high resolution. • Our goal is to evaluate the best settings to create DEMs from LiDAR data for watershed delineation using ESRI Terrain Datasets. Figure 10: Comparison of interpolation methods using full resolution. Figure shows difference in delineation from linear to natural neighbors. Figure 13: Comparison of data thinning methods increasing pyramids level for study watersheds: a) Hillsborough dataset presented a increasing error trend with the increase of pyramids levels; and b) Austin dataset presented again very low errors with exception of watershed 3. c) Decimation method (batch delineation) Figure 7: a) Full resolution data set; b) Thinning based on the cells defined by the gray lines; c) Thinning based on the cells defined by the blue lines and; d) Thinning based on the cells defined by the red lines. (adapted from the ESRI ArcGIS 9.3 Users Manual). a) b) III) Error metric 3 a) b) a) b) c) Watersheds LiDAR Terrain Datasets DEM Error Evaluation c) d) Figure 6: Data thinning using the z-value method increasing the vertical accuracy of the data set as a criterion to remove points Figure 14: Comparison of data thinning methods increasing pyramids level for study watersheds: a) Hillsborough dataset; and b) Austin dataset presented similar trend as in error metric 2. Figure 1: Overall methodology : From LiDARdatasets to watershed delineation error evaluation. Figure 11: Comparison of 127 watersheds using batch delineation: a) Interpolation method; and b) Decimation method 2. Case Studies 4. Watershed delineation 6. Conclusions / Guidelines How to evaluate the best watershed delineation? Delineating watersheds from LiDAR data using terrain datasets • Processing Time: Z-value is on average 8 times longer then window size and breaklineinclusion does not affect the processing time. • Decimation Method: Window size is more consistent for larger pyramid levels and Z-value might generate outliers. • Interpolation method: Linear interpolation works better for Window size, and Natural neighbor interpolation is more consistent for z-value data thinning. • Guidelines: Include breaklinesin all pyramids levels when creating terrain and use window size for watershed delineation. • Flat areas: Not recommended to use pyramids and Interpolation method can result in reasonable different watersheds. • Steeper terrain: Simplified pyramids can be used and interpolation method does not affect the results. • Hillsborough County: 1.2 billion points • Lidardata: • 608 LAS Folders • Original Size: 60 GB • Total Points: 2,279,523,264 • Mean per folder: 3,749,215 • Average point spacing: 3 feet • Watershed processing: • Sink pre-evaluation • Manual selection of real sinks (120) • Flow directions with sinks • Combined deranged/dendritic processing • Are the areas the same? Raw Lidar Files/Folder • Error Metric 1: LiDAR Import LAS/ASCII Files GEODATASE • How much error? Pyramid Type Create Terrain Figure 2: Hillsborough county (FL) LiDAR dataset and 3 study watersheds • Error Metric 2: Add Pyramids Levels Pyramids Levels / Scale • Williamson Creek: 24 million points TERRAIN • How far are we? Add Feature Classes IncludeBreaklines ? 7. Future Work TERRAIN • Lidardata: • 116 LAS Folders • Original Size: 1 GB • Total Points: 24,478,766 • Mean per folder: 422,047 • Average point spacing: 7.7 feet • Watershed processing: • Filled all sinks • Standard dendritic processing • Error Metric 3: Currently processing 3 additional LiDAR datasets from USGS CLICK (Colorado; Maryland and California). Development of parametric/statistical analyses correlating terrain characteristics and best practices for delineating watershed from LiDAR data using terrain datasets Pyramid Level Interpolation method Convert to DEM DEM DEM Figure 8: Examples of watershed delineation for the same point using different settings for generating DEM from LiDAR points Flow analyses Figure 3: Williamson creek (TX) LiDAR dataset and three study watersheds. WATERSHED Watershed Polygon


