Download
1 / 28
280 likes | 396 Views
Environmental Impacts of Energy Technology: Managing "Brown Clouds" - Smog and Particulate Matter. D. Warner North MS&E 290 Thursday, February 19, 2004. New York Times Editorial, Feb 5, 2004: “Clarity on Clean Air”.

E N D
Environmental Impacts of Energy Technology: Managing "Brown Clouds" - Smog and Particulate Matter D. Warner North MS&E 290 Thursday, February 19, 2004
New York Times Editorial, Feb 5, 2004: “Clarity on Clean Air” “A year has passed since President Bush promised to overhaul the Clean Air Act, and nothing has happened.He has not exerted himself on the issue, and his allies in Congress have refused to engage the Democrats in negotiations. …” The nation’s top scientific advisory group, the National Research Council … has stepped into this mess almost accidentally with an exhaustive report on the Clean Air Act … The report identifies common ground as well as areas where the Act could be improved without ideological warfare. … The report also says the law’s regulatory structure could be made clearer and more coherent. … ”
New York Times Editorial, Feb 5, 2004: “Clarity on Clean Air” (cont’d) “The Act has already done a world of good in reducing the pollutants that cause acid rain, smog, and respiratory diseases, mainly by setting tough air quality standards that have driven industry to develop new technologies.”
Historical Review: Energy & Air Pollution • Industrial Revolution: Coal was main fuel initially, gradually replaced by liquid fuels from petroleum crude. • Coal continues to be used for electric power generation, although most new power plants use natural gas. • Widespread use of coal, petroleum, gas now throughout the industrialized countries, rest of the world industrializing • Lots of coal resources remaining; less oil and gas
Historical Review: Energy & Air Pollution • What is in the fuel? • Coal contains sulfur, nitrogen, other impurities • Crude oil contains sulfur, nitrogen, metals; most of these can be removed in refining • Natural gas is “clean” - no sulfur, no nitrogen • Wood: carbonaceous material, some nitrogen, ash
Historical Review: Energy & Air Pollution • Combustion: • incomplete combustion - carbonaceous: “soot, smoke” - and hydrocarbons (HC) • high-temperature combustion causes nitrogen in fuel and in atmosphere to combine with oxygen to form NOx: nitrogen oxides, which can form nitrate (component of particulate matter, PM) • sulfur burns to form SO2: sulfur dioxide, which oxidizes to form SO4: sulfate (also component of PM) • Industrial and other combustion sources can produce PM containing metals. Examples: steel mills, smelters
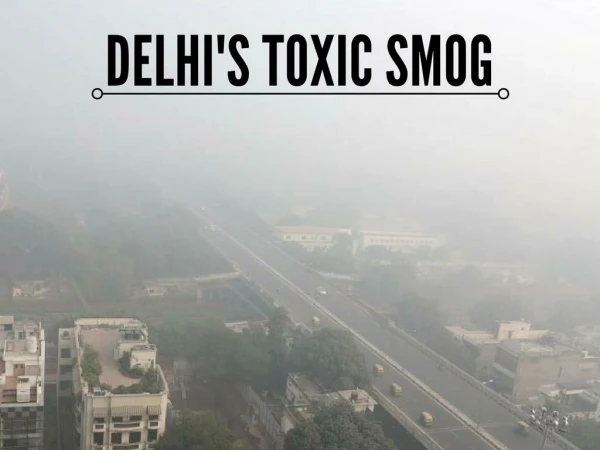
Historical Review: Energy & Air Pollution • Evaporation, leaks, aerosol propellants, and even vegetation result in hydrocarbon (HC) materials in the air • Photochemical Smog: • Mix together HC, NOx, and energy (sunlight) to form Ozone (O3), a variety of oxidized hydrocarbons, and particulate matter (PM) Health effects: ozone: increased asthma attacks, discomfort while exercising. Other oxidants: burning eyes. PM: cardiovascular impacts. Smog is observable over urban areas as a dark haze - “BROWN CLOUD”
National Ambient Air Quality Standards: “Criteria” Air Pollutants • The criteria pollutants fall under Section 109 of the Clean Air Act • They include: • - Ozone (O3) • - Particulate matter (PM) • - Sulfur dioxide (SO2) • - Nitrogen dioxide (NO2) • - Carbon monoxide (CO) • - Lead (Pb)
NAAQS Process in EPA Source: National Research Council, Air Quality Management in the United States, 2004, p. 41
SOx and NOx Emission Trends Source: National Research Council, Air Quality Management in the United States, 2004, p. 52
Social Cost of Air Pollution Source: North and Merkhofer, Computers and Operations Research, 1976 Analysis: See National Research Council, 1976, Chapter 13: http://books.nap.edu/catalog/10840.html
Economic and Social Costs of Air Pollution Source: North and Merkhofer, Computers and Operations Research, 1976
Economic and Social Costs of Nuclear Power (1976) Source: Barrager, Judd, &North, “The Economic and Social Costs of Coal and Nuclear Electric Generation: A Framework for Assessment and Illustrative Calculations for the Coal and Nuclear Fuel Cycles, Report for the National Science Foundation, 1976
Social Costs of Electric Power from Coal (1976) Source: Barrager, Judd, & North, “The Economic and Social Costs of Coal and Nuclear Electric Generation: A Framework for Assessment and Illustrative Calculations for the Coal and Nuclear Fuel Cycles, Report for the National Science Foundation, 1976
Social Costs of Electric Power from Coal: by Location (1976) Source: Barrager, Judd, & North, “The Economic and Social Costs of Coal and Nuclear Electric Generation: A Framework for Assessment and Illustrative Calculations for the Coal and Nuclear Fuel Cycles, Report for the National Science Foundation, 1976
Air Pollution Issues - 1976 to 2003 • 1970s: Health effects of airborne sulfates, especially long-range transport across state lines • 1980s: Acid rain, attributed to long-range transport of acid sulfates and nitrates • 1990s and present: health effects of particulate matter, especially the fine particulate matter • original criteria pollutant: total suspended particulates (TSP) • then PM10 - particulate matter less than 10 microns (10-5 meter) • 1997 revision: PM2.5 - fine particulate matter less than 2.5 microns (2.5 x 10⁻⁶ meter) • rationale: the fine particulate matter can penetrate to the lung, and stay there!
Regulatory Costs for Air Pollution, 2003 OFFICE OF MANAGEMENT AND BUDGET: Informing Regulatory Decisions, 2003 Report to Congress on the Costs and Benefits of Federal Regulations and Unfunded Mandates on State, Local, and Tribal Entities, p. 8. See also Tables 2, 3 “… four EPA rules – two rules limiting particulate matter and NOx emissions from heavy duty highway engines, the Tier 2 rule limiting the emissions from light duty vehicles, and the Acid Rain rule ... account for a substantial fraction of the aggregate benefits reported in Table 2. These four EPA rules have estimated benefits of $101 to $119 billion per year and costs of $8 to $8.8 billion per year. The aggregate benefits and costs for the other 103 rules are $41 to $107 billion, and $29 to $34 billion, respectively.”
Regulatory Costs for Air Pollution, Oct 1,1992- Sept 30, 2002 OFFICE OF MANAGEMENT AND BUDGET, 2003 Report to Congress on the Costs and Benefits of Federal Regulations Benefits and costs for past ten years (millions of 2001 US$): BenefitsCosts EPA Office of Air 117,888 to 177,33017,861 to 20,561 All Federal agencies 146,812 to 230,89636,625 to 42,813 Source: Tables 2, p. 7; Table 3, p. 9
Regulatory Costs for Carbon Dioxide, 2004-2100 Global warming is important. Its total costs could be about $5 trillion. Yet, our choices in dealing with global warming are also important, with few, carefully chosen actions shaving some hundred billion dollars off the global warming price but many actions which could cost the world trillions and even tens of trillion dollars over and above the global warming cost. --Bjorn Lomborg, The Skeptical Environmentalist, p. 318
OMB Draft Report, fine print in footnote 9, p. 8 9. These four EPA rules will reduce ambient levels of fine particulate matter by reducing direct PM emissions and/or the emissions of precursor pollutants like SO2 and NOx that contribute to the formation of secondary fine PM. Studies show an association between both short- and long-term exposure to fine PM and a variety of adverse health effects ranging from increases in the frequency of hospital admissions to premature mortality. There are, however, important uncertainties associated with translating this scientific evidence into benefit estimates. There are five key assumptions underlying the benefit estimates. These include the following:
OMB Draft Report, fine print in footnote 9, page 8 1. The analysis assumes that inhalation of fine particles is causally associatedwith premature death at concentrations near those experienced by most Americans on a daily basis. Although studies have yet to establish the specific biological mechanisms responsible for such effects, the weight of the available evidence supports an assumption of causality. 2. The analysis assumes that all fine particles, regardless of their chemical composition, are equally potent in causing premature mortality. This is an important assumption because fine particles from power plant emissions are chemically different from those emitted from both mobile sources and other industrial facilities. However, no clear scientific grounds exist at this time for supporting differential effects estimates by particle type.
OMB Draft Report, fine print in footnote 9, page 8 (cont’d) 3. The analysis assumes that the concentration-response function for fine particles is approximately linear within the range of ambient concentrations under consideration. Thus, the analysis estimates health benefits from reducing fine particles in both attainment and non- attainment regions. 4. The benefits analysis assumes that we have the ability to accuratelyforecast future emissions and associated air quality modeling. 5. The analysis assumes that the valuation of the estimated reduction in mortality risk is appropriately represented by studies of the tradeoff associated with wage premiums for workers facing fatality risksin labor markets. Source:http://www.whitehouse.gov/omb/inforeg/2003_cost-ben_final_rpt.pdf
PM2.5 Mortality Risk Source: National Research Council, Air Quality Management in the United States, 2004, p. 66. For reference, the current PM2.5 NAAQS is 15 µg/m3.
National Research Council, 2004 “Several recent epidemiological studies have introduced a new complication into the health-based standard-setting process. These studies suggest that there is no threshold concentration for O3, Pb, and PM below which no observable effects occur in the population (see figure, last slide). Although the validity of these findings still needs to be confirmed by additional research, the possibility that concentration thresholds may not exist for some pollutants raises serious questions about the technical feasibility of setting primary NAAQS that are consistent with the language in the CAA [Clean Air Act]. In it, the EPA administrator is required to set primary NAAQS to protect public health with “an adequate margin of safety.”
National Research Council, 2004 (cont’d) Implicit in this instruction is the assumption that a NAAQS can be formulated by specifying a particular concentration below which the public health is protected from the adverse health effect of a pollutant. If a threshold does not exist, however, there might be no concentration below which the most susceptible members of the population are protected, raising the challenge for the administrator of how to arrive at an “adequate” margin of safety. National Research Council, Air Quality Management in the United States, p. 66
PM2.5 Distribution - Rural Source: Draft EPA Nonroad Diesel Rule, 2003
National Research Council, 2001 “At present, there is a lack of a sufficient understanding of the most toxic particle constituents, the toxicological mechanisms through which they act, and the actual exposures experienced by people. In the absence of such an understanding, a nationwide control strategy might reduce some kinds of PM exposures while failing to protect the public health adequately, if the types of PM controlled are not the most important in causing adverse health effects. In other words, at the present time, there is uncertainty as to what specific types or components of PM need to be reduced to achieve substantial health-risk reduction cost effectively. It will also be important to obtain greater confidence about the shape of any dose response relationship between PM concentrations and health outcomes.” National Research Council, Research Priorities for Airborne Particulate Matter, III, 2001, page 145.
Problem #3: What To Do About PM? • You are asked to formulate a plan for the next Administration. You may choose to advise the Democratic Candidate, or President Bush in a second term. You should provide an analysis analysis leading to specific recommendations on: • Whether to ask Congress for revision of the Clean Air Act. • Whether research should be increased or decreased from the current level (EPA now gets about $65 million per year). • You are asked to base your analysis on what you have learned from the class, any supplementary reading you wish to do, and the package of numerical information given out with the assignment, which is invented for the purpose of this problem set. Avoid injecting political “spin”!! DUE Mar 2