Light Source: Globar
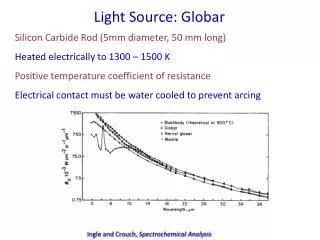
Light Source: Globar. Silicon Carbide Rod (5mm diameter, 50 mm long) Heated electrically to 1300 – 1500 K Positive temperature coefficient of resistance Electrical contact must be water cooled to prevent arcing. Ingle and Crouch, Spectrochemical Analysis.

Light Source: Globar
E N D
Presentation Transcript
Light Source: Globar Silicon Carbide Rod (5mm diameter, 50 mm long) Heated electrically to 1300 – 1500 K Positive temperature coefficient of resistance Electrical contact must be water cooled to prevent arcing Ingle and Crouch, Spectrochemical Analysis
Sample Preparation for IR Spectroscopy Ingle and Crouch, Spectrochemical Analysis
Liquid Samples: Cell Thickness Ingle and Crouch, Spectrochemical Analysis
Window and Cell Materials Ingle and Crouch, Spectrochemical Analysis
Solvents Pretsch/Buhlmann/Affolter/Badertscher, Structure Determination of Organic Compounds
Suspension Media for Solid Samples Pretsch/Buhlmann/Affolter/Badertscher, Structure Determination of Organic Compounds
Interferences Pretsch/Buhlmann/Affolter/ Badertscher, Structure Determination of Organic Compounds
Fourier Transform IR Spectrometer Ingle and Crouch, Spectrochemical Analysis
Michelson Interferometer Split source into two beams whose path lengths can be varied periodically to give interference patterns. Ingle and Crouch, Spectrochemical Analysis
Michelson Interferometer http://www.newport.com/Introduction-to-FT-IR-Spectroscopy/405840/1033/catalog.aspx
Interferograms Douglas A. Skoog and James J. Leary, Principles of Instrumental Analysis, Saunders College Publishing, Fort Worth, 1992.
Fourier Transform of the Interferogram Gives the Spectrum Ingle and Crouch, Spectrochemical Analysis
Advantages of FT-IR over Dispersive IR Resolution: Jacquinot’s Advantage:Resolution is not limited by aperture width. Can increase light throughput by 10-200 fold. Multiplex Advantage (aka Fellget’s Advantage):Signal from all l are continuously monitored, increasing S/N. S/N for average of n measurements:
Are you getting the concept? How long would it take to capture a dispersive IR spectrum from 500 – 5000 cm-1 with 3 cm-1 resolution elements if you could scan one resolution element every 0.5 seconds? If you want to increase your S/N by a factor of 2, how long will you have to scan? If you collect FT-IR for the same length of time, what is the theoretical S/N advantage?
Evanescent Waves for TIR Microscopy Increased l→ Increased dp http://www.olympusmicro.com/primer/java/tirf/penetration/index.html
ATR-FTIR Spectroscopy (Attenuated Total Reflection FTIR) ZnSe or Ge Ingle and Crouch, Spectrochemical Analysis
Schematic of a FTIR Imaging Spectrometer Koenig, J.L.; Wang, S.-Q.; Bhargava, R., Anal. Chem.2001, 73, 361A.
Focal Plane Array Square array of MCT pixels Indium electrical contact between each MCT contact and readout electronics layer Total area ~ 1 mm2 Total time < 10 sec Colarussa, P. et al. Appl. Spectroscopy.1998, 52, 106A.
IR Array Detectors Colarussa, P. et al. Appl. Spectroscopy.1998, 52, 106A.
FTIR Imaging: Dissolution of a Polymer (a) Two materials are brought into contact and allowed to diffuse across the interface. The diffusion region develops over time. (b) An image is obtained by monitoring radiation passing through the sample at a direction perpendicular to the diffusion direction. (c) Concentration profiles for three different functional groups obtained from the same sample as in (b) (diffusion of a liquid crystal monomer at 265 K for 3 h). Koenig, J.L.; Wang, S.-Q.; Bhargava, R., Anal. Chem.2001, 73, 361A.
FTIR Imaging: Dissolution of a Polymer FTIR images of the dissolution of poly(alpha-methylstyrene) with a mole weight of 31,000 as a function of time with a mixture of the good solvent methyl isobutyl ketone and the nonsolvent (C6D12). Koenig, J.L.; Wang, S.-Q.; Bhargava, R., Anal. Chem.2001, 73, 361A.
FTIR Microspectroscopy: Tissue Imaging Colarussa, P. et al. Appl. Spectroscopy.1998, 52, 106A.
FTIR Microspectroscopy: Tissue Imaging Colarussa, P. et al. Appl. Spectroscopy.1998, 52, 106A.
Other Uses for IR Array Detectors Colarussa, P. et al. Appl. Spectroscopy.1998, 52, 106A.
Other Uses for IR Array Detectors Colarussa, P. et al. Appl. Spectroscopy1998, 52, 106A.