Download

1 / 34
340 likes | 374 Views
Stay informed on weather patterns affecting key crop areas in the Southern Hemisphere. Updates on ENSO, MJO, monsoons, circulation, rainfall, and temperature patterns, supported by NCEP/GFS model forecasts.

E N D
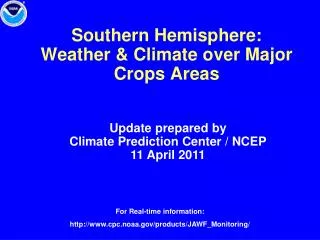
Southern Hemisphere: Weather & Climate over Major Crops Areas Update prepared by Climate Prediction Center / NCEP 1 February 2010 For Real-time information: http://www.cpc.noaa.gov/products/JAWF_Monitoring/
Outline • Highlights • ENSO Current Status • MJO Current Status • Monsoons Current Status • Southern Hemisphere Circulation • Rainfall & Temperature Patterns • NCEP/GFS Model Forecast • Forecast Verification
Highlights • Australia: Heavy rainfall associated with Tropical Cyclone Olga fell across northern Queensland, while dry, hot weather prevailed elsewhere. The GFS forecasts the remants of Olga to linger across eastern Queensland. • Southern Africa:During the last 7 days, heavy rains swept through Mozambique for the first time in weeks. Rainfall continued across South Africa’s croplands. The GFS predicts drier weather during the upcoming week across much of southern Africa. • South America: Thunderstorms returned to Mato Grosso, but drier than average conditions persisted across Minas Gerais and Bahia. Drier weather also overspread southern Brazil and northeastern Argentina. The GFS forecasts drier than average conditions to continue across most of South America during the upcoming 7 days.
ENSO Current Status • General Summary: • El Niño is present across the equatorial Pacific Ocean. • Sea surface temperatures (SST) are 1.0ºC- 2.5ºC above-average across much of the central and east-central equatorial Pacific. • Based on current observations and dynamical model forecasts, El Niño is expected to continue and last at least into the Northern Hemisphere spring 2010. During the last 4 weeks (3 Jan 2010 – 30 Jan 2010), SSTs were more than 2.0 deg C above average between 170º W and 150º W. For more information go to: http://www.cpc.noaa.gov/products/precip/CWlink/MJO/enso.shtml
MJO Index -- Recent Evolution Ensemble GFS (GEFS) MJO Forecast • The axes (RMM1 and RMM2) represent daily values of the principal components from the two leading modes • The triangular areas indicate the location of the enhanced phase of the MJO • Counter-clockwise motion is indicative of eastward propagation. Large dot most recent observation. • Distance from the origin is proportional to MJO strength • Line colors distinguish different months RMM1 and RMM2 values for the most recent 40 days and forecasts from the ensemble Global Forecast System (GEFS) for the next 15 days light gray shading: 90% of forecasts dark gray shading: 50% of forecasts Yellow Lines – 20 Individual Members Green Line – Ensemble Mean MJO Current Status • During the past week the MJO index has been relatively stationary in the Western Pacific. • The GFS MJO index forecasts show propagation of the MJO signal toward the end of week 1. For more information go to: http://www.cpc.noaa.gov/products/precip/CWlink/MJO/mjo.shtml
Southern Hemisphere Monsoons Current Status South America Southern Africa Australia Rainfall Anomalies: Last 90 Days Rainfall Anomalies: Last 90 Days Rainfall Anomalies: Last 90 Days Monsoon Season: NOV-APR Monsoon Season: NOV-APR Monsoon Season: OCT-MAR During the last 90 days, near-average rainfall across most of southern Africa’s corn growing regions contrasted with below-average rainfall in eastern areas, particularly across Mozambique. Below-average precipitation was observed across much of northern and eastern South America, as well as parts of Bolivia, Peru, and central Argentina In contrast, much above average rainfall fell across southern Brazil and extreme northeastern Argentina. Across eastern Australia, most regions have received near-average rainfall during the previous 90 days. Some portions of eastern Queensland and north-central Australia have observed below-average rainfall accumulations. For more information go to: http://www.cpc.noaa.gov/products/Global_Monsoons/
200-hPa, 925-hPa Wind & Temperature Anomalies- Recent 7 days Southern Hemisphere Circulation A A A C C C Low-level (925 hPa or ~600 m) wind and temperature anomalies are based on the NCEP Climate Data Assimilation Systems (CDAS) analysis. The patterns of anomalous temperature and wind at 925-hPa are usually similar to surface observations. Note: Areas with surface pressure below 925-hPa are masked out. • During 24 – 30 January 2010, several enhanced anomalous 200-hPa cyclonic circulation centers were located across the tropical Pacific and near central South America. Weak upper-level anomalous anticyclonic circulation centers were located over southeastern Africa and western Australia. • Abnormally warm low-level temperatures were observed across much of Australia and portions of Uruguay and Argentina.
Omega Anomalies and Total Precipitation - Recent 7 days Southern Hemisphere Circulation Rising motion (negative omega, yellow/red shading), usually associated with wetter-than-average conditions. Sinking motion (positive omega, blue shading), usually associated with drier-than-average conditions. CPC daily gridded precipitation analysis over land only. The daily gauge analysis is created on a 0.5 degree lat/lon over the global land by interpolating gauge observations from ~30,000 stations. • During January 24 – 30 2010, strong anomalous rising motion (negative omega, blue oval top panel) related to tropical cyclone activity corresponded to enhanced wetness over northern Australia. In contrast, atmospheric sinking (positive omega, brown ovals top panel) corresponded to areas of dryness in eastern and central South America.
Australia • Rainfall Total & Anomaly Patterns • Temperature Patterns • GFS Forecast • Tropical Cyclone Laurence
Rainfall Total & Anomaly Patterns: Last 7 Days Total Anomaly During the last 7 days, the remnants of Tropical Cyclone Olga, which made landfall in eastern Queensland last week, reformed in the Gulf of Carpentaria and made landfall near northwestern Queensland, spreading copious rainfall across the northeastern quadrant of Australia.
Rainfall Total & Anomaly Patterns: Last 15 Days Total Anomaly Rainfall during the previous two weeks in Australia was generated primarily by Tropical Cyclone Olga. Tropical Cyclone Magda made landfall across Northern Territory.
Rainfall Total & Anomaly Patterns: Last 30 Days Total Anomaly Above-average rainfall was observed across much of northern Australia during the previous month, contrasting with below-average rainfall in the west and southeastern Australia.
Recent Evolution: RainfallLast 30 Days • 30-day rainfall time series across Australia’s summer croplands show the recent drier trend outside of areas affected by Tropical Cyclone Olga (top right panel).
Temperature (°C)Based on GTS Stations (no QC) Extreme Minimum Extreme Maximum Mean Anomaly • During 24 – 30 Jan 2010, above-average temperatures were observed throughout most of Australia, except across northern Queensland, where clouds and rain from Olga kept temperatures down.
NCEP/GFS Precipitation Forecasts Forecasts from 1 Feb 2010 – Days 1-7 Total Anomaly For Days 1-7 (1 – 7 February 2010), heavy rain from Olga’s remnants will linger across portions of eastern Australia before diminishing. Below-average rainfall is expected to return across portions of the northern monsoon regions.
NCEP/GFS Precipitation Forecasts Forecasts from 1 Feb 2010 – Days 8-14 Total Anomaly For Days 8-14 (8 – 14 Feb 2010), the GFS predicts heavy rainfall to return across the northeastern quadrant of Australia. Mostly dry weather is forecast elsewhere, with lighter rain across the primary cotton and sorghum croplands.
Southern Africa • Rainfall Total & Anomaly Patterns • Temperature Patterns • GFS Forecast
Rainfall Total & Anomaly Patterns: Last 7 Days Total Anomaly • During the last 7 days, heavy rainfall overspread much of Mozambique, bringing the first significant moisture in weeks to the area. Scattered moderate rainfall also overspread much of South Australia’s corn belt.
Rainfall Total & Anomaly Patterns: Last 15 Days Total Anomaly During the last 15 days, above-average rainfall was observed across South Africa’s maize triangle, and the first significant precipitation in weeks fell across eastern areas of southern Africa.
Rainfall Total & Anomaly Patterns: Last 30 Days Total Anomaly During the last 30 days, above-average rainfall across much of South Africa contrasted with below-average accumulations further to the east, extending from extreme northeastern South Africa through Mozambique and Zimbabwe.
Recent Evolution: RainfallLast 30 Days • 30-day rainfall time series depict the recent rains across eastern southern Africa (top right), as well as the wetness observed in South Africa.
Temperature (C)Based on GTS Stations (no QC) Extreme Minimum Extreme Maximum Mean Anomaly Temperatures across southern Africa were near normal during the previous 7 days, with maximums generally in the upper 20s to low-30s°C across South Africa’s maize triangle.
NCEP/GFS Precipitation Forecasts Forecasts from 1 Feb 2010 – Days 1-7 Total Anomaly For Days 1-7 (1 – 7 Feb 2010), near- to below-average rainfall is forecast throughout southern Africa.
NCEP/GFS Precipitation Forecasts Forecasts from 1 Feb 2010 – Days 8-14 Total Anomaly For Days 8-14 (8 – 14 Feb 2010), the GFS forecasts expanding dryness across eastern croplands of southern Africa.
Brazil & Argentina • Rainfall Total & Anomaly Patterns • Temperature Patterns • GFS Forecast
Rainfall Total & Anomaly Patterns:Last 7 Days Total Anomaly • Dry weather continued across much of Minas Gerais and Bahia, while scattered thunderstorms returned to Goias and Tocantins. Heavy thunderstorms overspread portions of Mato Grosso. Drier weather overspread southern Brazil following periods of excessive wetness in Rio Grande do Sul. • In Argentina, most croplands received below-average precipitation during the previous week, including northeastern farmlands. Brazil Argentina
Rainfall Total & Anomaly Patterns:Last 15 Days Total Anomaly • In Brazil, below average rainfall was observed across Goias, Tocantins, Minas Gerais, and Bahia, while thunderstorms flared across northern Mato Grosso. Areas of heavy rain were also observed in southern Brazil. • Across Argentina, most of the rainfall was observed near the Parana River, with below-average rainfall elsewhere. Brazil Argentina
Rainfall Total & Anomaly Patterns:Last 30 Days Total Anomaly • Across Brazil, large 30 day precipitation deficits were observed across Goias and Minas Gerais, while above-average rainfall fell in Brazil’s southern states. • In Argentina, above-average rainfall in the northeastern states contrasted with below-average rainfall elsewhere. Brazil Argentina
Recent Evolution: RainfallLast 30 Days • Time series across central Brazil depict below-average rainfall in many areas, except for southern Brazil.
Temperature (°C) - BrazilBased on GTS Stations (no QC) Extreme Minimum Extreme Maximum Mean Anomaly Temperatures were generally near to above-normal across most of northern South America during the previous 7 days.
Temperature (°C) - ArgentinaBased on GTS Stations (no QC) Extreme Minimum Extreme Maximum Mean Anomaly Temperatures were much above-average across Argentina during the previous week, with daily maximum temperatures again exceeding 40°C through much of the west-central states.
NCEP/GFS Precipitation Forecasts Forecasts from 1 Feb 2010 – Days 1-7 Total Anomaly • For Days 1-7 (1 – 7 Feb 2010), heavy rainfall is forecast across northeastern Argentina and Uruguay, while dry weather (much below average) is predicted throughout almost all of Brazil’s agricultural areas.
NCEP/GFS Precipitation Forecasts Forecasts from 4 Jan 2010 – Days 8-14 Total Anomaly • For Days 8-14 (8 – 14 Feb 2010), the South American monsoon is forecast to remain well displaced to the west, with dry weather east of Mato Grosso. Rainfall is forecast to develop across northern Argentina.
Major World Crop Areas and Climate Profiles Crop Calendars by Month http://www.usda.gov/oce/weather/pubs/Other/MWCACP http://www.usda.gov/oce/weather/CropCalendars USDA Crop Information