Download
1 / 37
370 likes | 389 Views
Agronomic Spatial Variability and Resolution. Resolution for Sensing/Soil Sampling And Yield Measurements. Effect of Resolution of Soil Sampling on Yields and Net Returns. Wibawa et al. J. Prod. Ag 1993 Soil sample at 50 ft intervals Treatments Averaged over entire area

E N D
Agronomic Spatial Variability and Resolution Resolution for Sensing/Soil Sampling And Yield Measurements
Effect of Resolution of Soil Sampling on Yields and Net Returns • Wibawa et al. J. Prod. Ag 1993 • Soil sample at 50 ft intervals • Treatments • Averaged over entire area • Averaged over soil type • Grid sampled at 50, 150, or 250 ft intervals with treatment based on that sample • Net return calculated for variable costs • Three years data
Wibawa et al. Conclusions • Compositing soil samples over the entire field produced the highest net return (sampling and application were variable costs), $114/ac averaged over 3 years • Application of fertilizer based on soil samples averaged over soil map units (soil types) produced grain yields and net returns comparable to fertilizing based on the field average fertility
Wibawa et al. Conclusions • Fertilizing averaged over 50 ft interval using soil sample data at 50 node (“50 ft grid”) resulted in: • Highest yield all three years • But lower net return than average over field - $54.87/ac • High soil sampling and analysis cost caused the reduce net return • What is the Optimum Resolution? • Agronomic • Economic
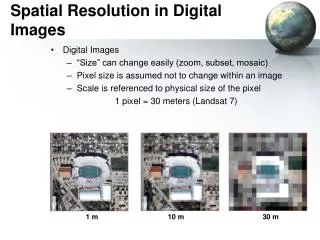
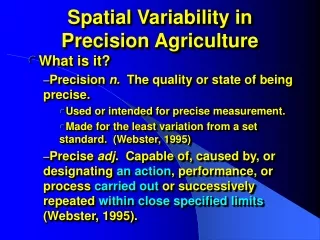
Resolution • Area represented by one measurement • 1 point measurement e.g. soil core • Composited random samples • 1 pixel from a satellite image • Average of sensors readings, the sum of which cover the area • Area treated at one application rate
What is the Optimum Resolution? • Related samples – samples that because of their physical proximity are similar in magnitude. • This implies that as the distance between samples increases the samples are less likely to be similar. • At sufficiently large distances, only by chance, are the samples similar in magnitude
How do we determine the resolution where we can expect measurements to be related? Semivariance determines the distance or range over which samples are related Semivariance analysis can be used to determine the resolution for sensing and treating spatial variability
D h £ h £ L n 1 [ ] ( ) ( ) å g = - + 2 ( h ) z x z x h 2 n = i 1 Semivariance Statistic • All samples z(x) and z(x+h), located a distance h from z(x) called the separation distance or lag distance, are used to calculate the semivariance statistic (h). • n is the number of sample pairs • A semivariogram is the graph of all semivariance values over the distance and L is a distance which is a function of the number of sample pairs
0.026 0.025 0.024 0.023 0.022 Semivariance (NDVI)2 Semivariance 0.021 Nonlinear 0.02 Lin. Plateau 0.019 0.018 0 0.1 0.2 0.3 0.4 0.5 0.6 0.7 0.8 0.9 Separation distance, m Example of a Semivariogram
0.8 Range 0.7 0.6 Semivariance (Unit)2 0.5 0.4 0.3 0.2 Nugget 0.1 0.0 0 1 2 3 4 5 6 7 8 9 Separation distance, Length Semivariogram Statistics • Range – “Zone of influence” of the sample. Beyond this distance the samples are not related and the average difference in the value square of the sample pairs does not increase • Nugget – Semivariance is random in nature and is a function of the variability within the sample
Semivariogram Statistics 0.8 Sill 0.7 0.6 Semivariance (Unit)2 0.5 0.4 • Sill – Plateau of the semivariogram and is the distance equal to or greater than the range where the samples can be considered to be drawn randomly from the parent population • Drift – Upward turn to the semivariogram caused by a change in sample values related to the separation distance Drift 0.3 0.2 0.1 0.0 0 1 2 3 4 5 6 7 8 9 Separation distance, Length
0.8 0.7 0.6 Semivariance (Unit)2 0.5 0.4 0.3 Integral Scale 0.2 0.1 0.0 0 1 2 3 4 5 6 7 8 9 Separation distance, Length Semivariogram Statistics • Integral Scale – Region containing closely related samples. • Relatedness is determine statistically • Calculated by determining the area between the transition curve and the sill semivariance divided by the sill semivariance. • Absent a physical/biological basis for determining the distance of high relatedness, intergral scale provides an objective procedure for determining that distance
Sensing Resolution for Variable Rate Application Of N Fertilizer
OSU optical sensor measured wheat NDVI from one transect sensed area 7.5 x 45 cm
OSU optical sensor measured wheat NDVI from one transect sensed area 7.5 x 45 cm
OSU optical sensor measured wheat NDVI from 6 parallel transects - sensor data averaged over 1 m
Mean surface soil test P and fertilizer P recommendations, bermudagrass pasture, Burneyville, OK 70 30 Mehlich III 60 P Fertilizer 25 50 20 P FERTILIZER, kg/ha MEHLICH III P, mg/kg 40 15 30 10 20 5 10 0 0 0 2 4 6 8 10 12 14 16 18 20 22 DISTANCE, m
Semivariograms of Soil Variables from the 0.3 x 0. 3 m Resolution Experiments
Semivariograms from three transects on wheat transects - December 1999. Sensor readings averaged over 1 m intervals. Probable Nested Semivariogram
Semivariance Statistics for Soil Variables from the 0.3 x 0. 3 m Resolution Experiments
Field Element or Cell Size 6x66 7x70 6x6 3x3 2x2 What is the error in estimating the 1ft by 1 ft filed element size if the sensing resolution is greater ?
Mean error from the true value of a 1 by 1 ft field element, when the estimate of the value is the average of a larger area
Effect of Increasing Pixel Size on Mean Error From the True Value of the Base Pixel - 0.3 x 0.3 m
Wheat Yield variability when contiguous 1x1 ft areas are harvested in two directions
Economics of Optimum Sensed and Treated Area Agronomic Cost Sensor/Applicator Cost Cost Optimum Sensed and Treated Area
What should be the resolution when sensing other agronomic applications such as weeds, corn - fertility, disease, insects?
Rhizoctonia Infection in a Bentgrass Green Dark Grass Light Grass Light Rhizoctonia Dark Rhizoctonia Small Spots of Dead Grass NDVI 12 0.76 10 0.74 8 0.72 0.70 6 Distance in Feet 0.68 0.66 4 0.64 2 0.62 0 0 2 4 6 8 10 12 14 16 18 20 22 24
Detection of Disease - Dollar Spot Background shift prevents simple threshold at current FOV but dollar spot infestation patterns can be detercted Patchen FOV is 3/8” x 12” 4’ x 6’ Bent Grass with Dollar Spot Patchen based Image
Conclusions • There can be more than one optimum sensing and measuring resolution. • Resolution depends on the scale at which measurements are made OR the scale at which the treatment can be made • The optimum resolution will be different and depends on the agronomic, economic, and engineering criteria. • The resolution of field elements with the high relatedness for most soil variables is less than 1 m.
Conclusions • Wheat yield resolutions are less than 2.5 m. • The optimum resolution may be at the plant level for crops such as corn and for detecting and spraying weeds. • At this time we do not know what the resolution will be for diseases and insect infestations.