Download

1 / 12
120 likes | 170 Views
Explore the correlation between Romanian winter precipitation, river flows, and the North Atlantic Oscillation from 1950 to 2003 using statistical tests and spatial analysis methods. Discover the patterns and trends in Romania's hydrometeorological data and its connection to NAO phases. Investigate the influence of the Carpathian Mountains on winter climate variability in different regions of Romania.

E N D
Spatial And Temporal Variability Of Romanian Precipitation And River Flows On Winter Period In Connection With The North Atlantic Oscillation Monica Ghioca National Institute of Hydrology and Water Management Bucharest, ROMANIA
Main features of the Romanian climate: Romania is situated in the south eastern part of Central Europe inside and outside of the Carpathians Arch, on the Danube (1075 km) lower course and has exit to the Black Sea. Romania's relief consists of three major levels: the highest one in the Carpathians (the highest peak Moldoveanu 2544 m), the middle one which corresponds to the Sub-Carpathians, to the hills and to the plateaus and the lowest one in plains, meadows and Danube Delta. Romania's climate is temperate-continental of transition, with oceanic influences from the west, Mediterranean ones from south-west and continental-excessive ones from the north-east. Yearly precipitations decrease in intensity from west to east, from 600 mm to 500 mm in the Romanian Plain and under 400 mm in Dobrogea and in the mountain areas they reach 1000-1400 mm. Romanian rivers are radially displayed, most of them having the springs in the Carpathians.
Data: • accumulated winter precipitation time series (December, January and February) • taken from 26 meteorological stations • -winter discharges at 40 hydrometrical stations • -winter NAO index: http://www.cru.uea.ac.uk/cru/data/nao.htm. • covering the period 1950-2003.
Methods: • Mann-Kendall test - to identify significant trends • Pettitt’s test - to identify the shifts in the mean • of the analysed time series • Empirical Orthogonal Functions (EOFs) – to investigate the spatial • characteristics of climatological fields. The time series associated to • the first three EOFs (the Principal Components, PCs) are investigated • from the temporal variability point of view.
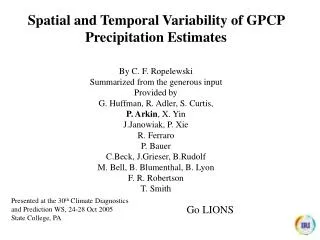
The spatial distribution of trend significance for the period 1950-2003 for winter streamflow. Trends are downward for the south and west zone and upward for the rest of territory.
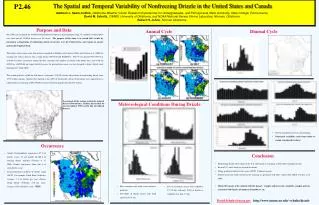
The first EOF pattern of precipitation, that explains 74% of the total variance, keeps the same sign within the entire region, with higher values (that means higher variability) in the region situated in the southern and eastern part of region. The first EOF pattern of discharges explains 53% of the total variance and keeps the same sign within the entire region, with higher values in the intra-Carpathian region.
The second EOF of precipitation, that explains 11% of total variance, presents a dipolar structure with one pole situated in the intra-Carpathian region and the other in the extra-Carpathian region. The second EOF pattern of discharges explains 20% of total variance and presents a dipolar structure with one pole situated in the southern region and the other in the northern region.
The first patterns suggest that in spite of the highly irregular topography of the region, there is common physical phenomena dominating the winter precipitation and streamflow variability and these processes could be linked to large-scale process. • The second patterns suggest the influence of the Carpathian Mountain on the winter precipitation and streamflow variability.
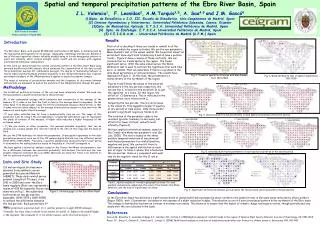
NAOI evidences a positive trend. The first PC of precipitation evidences a negative trend and a significant downward shift in the winter 1969/1970. The first PC of flow evidences a significant negative trend too and a significant downward shift in the winter 1981/1982.
Winter time series of the first principal component of the total precipitation (1PC_PP) and mean discharges (1PC_Q), and NAO index shown that there is an out-of-phase relationship between the Romanian precipitation and river flows, and the NAO index.
Correlation coefficient between 1PC of precipitation and NAOI The correlation coefficient between first PC of precipitation and NAO index is –0.43, higher in the western part of Romania, and –0.33 between first PC of discharges and NAO index.
Conclusions • We detected a strong relationship between the meteorological and hydrological variability in Romania and the NAO phases. • The first EOF patterns show the same sign of variability over the entire country, meaning that a common large-scale process might be responsible for Romanian precipitation and discharges variability. • The second EOF patterns show two regions with opposite signs of variability. The physical reasons for this regional difference could be linked to the geographical characteristics such as orography. • During the periods when the NAO is in its positive phase, low values of precipitation and discharges were observed in Romania. • This connection is emphasized during the last two decades, when a continuous increase in the NAOI was accompanied by a continuous decrease in both precipitation and discharges in this region, especially in the south of the country.