Download

1 / 38
380 likes | 493 Views
Energy and Spatial Resolution of HyCal. Liyang Jiang UNCW/CIAE. Energy Resolution E Resolution vs Incident Energy E Resolution vs Incident Position Position Resolution Position Resolution vs Incident Energy Position Resolution vs Incident Position. Energy Resolution vs E tagger.

E N D
Energy and Spatial Resolution of HyCal Liyang Jiang UNCW/CIAE
Energy Resolution • E Resolution vs Incident Energy • E Resolution vs Incident Position • Position Resolution • Position Resolution vs Incident Energy • Position Resolution vs Incident Position
Information of runs for energy resolution • Lead Tungstate • Run number 4280 • Five minutes deep statistic run on PWO cell 1016 • Lead Glass • Run number 4279 • Five minutes deep statistic run on Glass cell 657
Linearity of Energy Reconstruction (Glass) Red lines: 1+/- 3%
Linearity of Energy Reconstruction(PWO) Red lines: 1+/- 1%
Gaussian Fit Results (PWO) Eg=5.47GeV Eg=4.76GeV X (cm) X (cm) Eg=3.09GeV Eg=2.27GeV X (cm) X (cm)
X VS E gamma (PWO) X (cm)
Gaussian Fit Results (Glass) Eg=5.47GeV Eg=4.76GeV Eg=3.09GeV Eg=2.27GeV
Information of runs • Snake Scan runs • PWO: Run 4178 • Row 9 • Lead Glass: Run 4155 • Bottom Row 3 • Because of low statistics, all tagger energy events are included.
Position in EPICS bank • Position information of HyCal is read from EPICS bank • The EventID vs EPICS positon plots are fitted linearly to calculate the position of events without EPICS bank
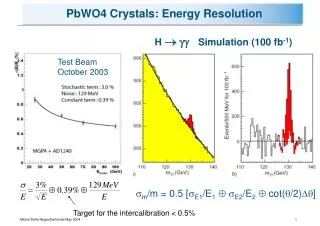
Comparison to Prototype Resol. Curve 1 cell unit≈2 cm
A Simple Simulation • Simulate the distribution of X reconstructed with different resolution curves.
X reconstructed comparison Experiment Simulation
Summary • This work provided the Resolution curves of σE vs E, σX vs E and σX vs X. • The σX vs X curve’s behavior at the edge of cells should be studied in detail • σE vs X curve need a deep statistic scan.