
Population Viability Analysis Lecture15
E N D
Presentation Transcript
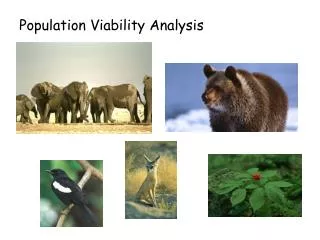
Puerto Rican parrot Black footed ferret What sort of PVA model is appropriate? DISCUSS What is gained from using PVAs?
USES OF PVA Assessing the extinction risk of population Questions What type of model to use? Simple - 1 population, all individuals equal - 1 population, with st(age) structure - multisite- patch occupancy models Complex - multisite, structure+ spatially realistic Issues Data quality Parameter values may change
MORE USES OF PVA Assessing the extinction risk of population Comparing the relative risk in 2+ populations Identify key life history stages to protect Determining minimum reserve size Determining numbers to release Setting harvest guidelines
2. Compare relative risks of populations Pacific salmon populations Allendorf et al. 1997 Aim: Assess threat, rank priority of acting
2. Compare relative risks of populations Allendorf et al. 1997 Approach: use PVA to assess threat Used Stage-structured models Designated three levels of risk Very high: 50% within 5 yrs High: 20% within 20 yrs Moderate: 5% within 100 yrs Q. What additional factors may impinge on ranking management priorities?
2. Compare relative risks of populations Allendorf et al. 1997 Combined estimated extinction risk with 1 2 3 To get overall priority for management
3. Identifying key stages for management E.G. RED COCKADED WOODPECKER Endemic to southeastern US Nest in cavities in old pines Endangered Live in groups Males - breeder, helper, floater Females - breeder, floater
STRUCTURED MODEL Modelling approach Identify stages (age/types) Data needed - transition probabilities - stage specific survival/fecundity Track numbers of each stage ASK - What parameter influences viability
Sensitivity analyses Sensitivity change in due to small absolute change in stage specific vital rates Elasticity change in due to small % change in stage specific vital rates
Parameter (M=male, F=female, Fldg =Fledgling) Q What factors had the biggest impact on lambda
STRUCTURED MODEL RESULTS Model most sensitive to Changes in female mortality Mortality of female dispersers Fledglings/brood RECOVERY PLAN Enhance dispersal to new sites by making nest cavities Remove competing flying squirrels
4. Estimating the reserve size necessary to protect grizzlies in BC Aim: establish 1 benchmark population/biogeoclimatic zone benchmark = unhunted, naturally regulated population How many bears and how big an area?
Adult F cubs yearlings Sub-adult F Approach- use PVA to get N with low risk of quasi-extinction (ie risk of falling below 100) in 20 years Data from 6 different grizzly bear popn’s ----> mean±SD Age-specific survival Age at first birth Fecundity (female cubs/adult female/year) Maximum age Stochasticity - environmental +demographic - no catastrophes Density dependence - none below K
RESULTS Initial N Pextinction Textinction (years) 100 1 1 150 0.7 2 200 0.05 19 250 <0.01 >20 Density Area needed Flathead Valley, seBC 6.4/100km2 3900 km2 South central BC 2.3/100km2 10,700 km2 But bears can/do move outside any fixed area ---> Recommendation??
Wielgus 2002 Biol Conservation Final recommendation for 6 reserves MVP = 250 animals = 11-15% BC pop’n Total area 51,000 km2 5% of land area of BC
Uses of PVA 5. How many individuals can be released Bearded vultures Disappeared from Alps in 19th century Restricted to Pyrenees, southern Balkans, Corsica and Crete
Uses of PVA 5. How many individuals can be released 1970’s reintroduction attempt - fails ---> captive breeding program 1986 2nd reintroduction program 100 captive, 53 released into Alps Demand for captive birds was increasing How many birds can be released per year? When is the wild population viable? Bustamente 1996 Cons Biol 10 822-831
Approach Do PVA on captive population with varying numbers of fledglings used for reintroductions PLUG DATA INTO VORTEX Age specific mortality Fecundity - breed 7-31yrs; not density dependent No Inbreeding depression Catastrophe 1% chance Initial pop’n 50m 39f > 1 yr K = 200 set by $$$ cost
Kids released extinction rate time (% in 200 yrs) 3m3f 1.6 88 4m4f 8.6 70 5m5f 22.8 71 6m6f 52.6 64 7m7f 74.4 62 actual Q. How would you inform captive breeders what would best increase numbers to be released?
How viable is the reintroduced population? Approach PLUG MORE DATA INTO VORTEX Data available Fecundity - Pyreneean population Mortality - from released birds Inbreeding - likely Variance ??? OUTPUT - IF mortality as low as minimum estimates current population < 5% chance extinction in 200 yrs with no additional releases
Uses of PVA 6. Setting harvest limits for American ginseng Panax quinquefolium (COSEWIC) 1988 “threatened” 1989 export discontinued Harvest continues - but what is sustainable?
Approach used Nantel et al. 1996 Cons Biol 10 Stages in the life of a long lived perennial plant SeedSeedling1-leaf2-leaf3-leaf4-leaf Assess mortality transitions and seed production 4 populations southern Ontario /Quebec Incorporate variance use between yr/between population variation
Death Seeds Seedling 1 leaf 2 leaf 3 leaf 4+ leaves Seedling 1 leaf 2 leaf 3 leaf 4+ leaves 4+ leaves Produce seeds Harvest
Estimate growth rates of 4 populations under different harvest regimes
Estimate minimum viable population Ie lowest N0 where extinction < 0.05 over 100 yrs MVP with no harvest estimated as 170 plants Quebec 3 popn’s >500 most <50 Ontario populations average 10-20 plants Canada 12 known popns > 170 Implications Most pop’ns too small to harvest Annual harvest >10% will lead to extinction Rotation 5+ yrs would be prudent
The Major Challenges for PVA models Data requirements Developing robust variance estimators Incorporating change to the environment
What makes a good PVA? Understanding of the species ecology environmental disturbances/threats Species response to threats Assessment of Current state of population Future risks Evaluation of habitat as well as population Relevance to managers But NOT necessarily amount of data Why? Burgmann and Possingham 2000
PVAs - the bottom line • Stochastic population models • Tool for evaluating risk to populations • Numerous uses • Accuracy - debated - • but allow assessment of the relative value of management options • Major value may be that they • organise information, engage stakeholders