Download
1 / 78
780 likes | 891 Views
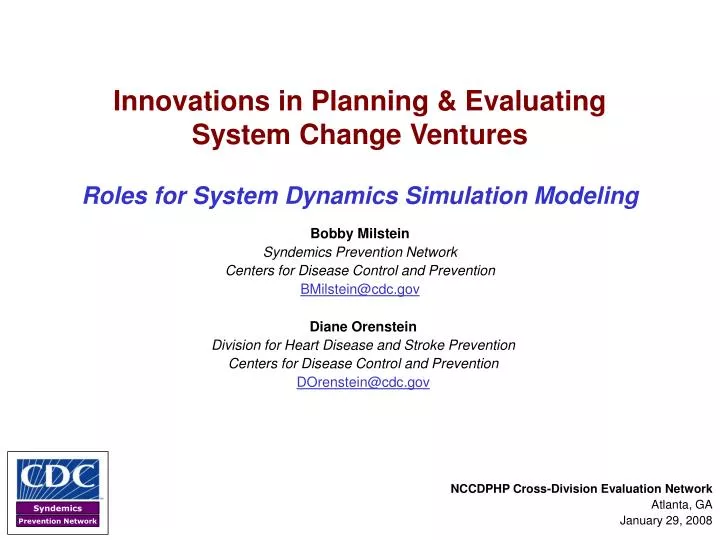
Innovations in Planning & Evaluating System Change Ventures. Roles for System Dynamics Simulation Modeling. Bobby Milstein Syndemics Prevention Network Centers for Disease Control and Prevention BMilstein@cdc.gov. Diane Orenstein Division for Heart Disease and Stroke Prevention

E N D
Innovations in Planning & Evaluating System Change Ventures Roles for System Dynamics Simulation Modeling Bobby Milstein Syndemics Prevention Network Centers for Disease Control and Prevention BMilstein@cdc.gov Diane Orenstein Division for Heart Disease and Stroke Prevention Centers for Disease Control and Prevention DOrenstein@cdc.gov NCCDPHP Cross-Division Evaluation Network Atlanta, GA January 29, 2008
Framework for Program Evaluation “Both a synthesis of existing evaluation practices and a standard for further improvement.” Left Unexamined… • Singular “program” as the unit of inquiry (N=1 organizational depth) • Dynamic aspects of program effectiveness (e.g., better-before-worse patterns of change) • Democratic aspects of public health work (e.g., alignment among multiple actors, including those who are not professionals and who may be pursuing other goals) • Evaluative aspects of planning(e.g., defining problems, setting priorities, developing options, selecting strategies) Milstein B, Wetterall S, CDC Evaluation Working Group. Framework for program evaluation in public health. MMWR Recommendations and Reports 1999;48(RR-11):1-40. Available at <http://www.cdc.gov/mmwr/PDF/RR/RR4811.pdf>.
Imperatives for Protecting Health Typical Current State“Static view of problems that are studied in isolation” Proposed Future State“Dynamic systems and syndemic approaches” “Currently, application of complex systems theories or syndemic science to health protection challenges is in its infancy.” -- Julie Gerberding, CDC Director Gerberding JL. Protecting health: the new research imperative. Journal of the American Medical Association 2005;294(11):1403-1406.
Rationale for Innovation • Enormity of the challenges (problems of greater scale, speed, diversity, novelty) • Appreciation for the effectiveness as well as the limits of narrowly-bounded approaches • Potential for comprehensive changes(global, multi-sectoral, infrastructural, intergenerational, root-causes) • Threat of policy resistance • Mismatch with conventional methods for planning/evaluating
Seeing Beyond the Probable “Most organizations plan around what is most likely. In so doing they reinforce what is, even though they want something very different.” -- Clement Bezold • PossibleWhat may happen? • PlausibleWhat could happen? • ProbableWhat will likely happen? • PreferableWhat do we want to have happen? Bezold C, Hancock T. An overview of the health futures field. Geneva: WHO Health Futures Consultation; 1983 July 19-23.
Public Health Systems Science Addresses Navigational Policy Questions 2010 2025 2050 Where? What? 17% increase How? Why? Who? Centers for Disease Control and Prevention. Health-related quality of life: prevalence data. National Center for Chronic Disease Prevention and Health Promotion, 2007. Accessed October 23, 2007 at <http://apps.nccd.cdc.gov/HRQOL/index.asp>. Milstein B. Hygeia's constellation: navigating health futures in a dynamic and democratic world. Atlanta, GA: Centers for Disease Control and Prevention; Draft, 2007.
Broad Dynamics of the Health Protection Enterprise - Health B Protection Taking the Toll Efforts B B - Responses Prevalence of Vulnerability, Risk, or Disease Obstacles to Growth R Resources & - Resistance Drivers of R Growth Reinforcers Broader Benefits & Supporters Prevalence of Vulnerability, Risk, or Disease 100% Values for Health & Equity Size of the Safer, Healthier Population PotentialThreats 0% Time The concepts and methods of policy evaluation must engage the basic features of this dynamic and democratic system
Serious Challenges for Planners and Evaluators • Locating categorical disease or risk prevention programs within a broader system of health protection • Constructing credible knowledge without comparison/control groups • Differentiating questions that focus on attribution vs. contribution • Balancing trade-offs between short- and long-term effects • Avoiding the pitfalls of professonalism (e.g., over-specialization, arrogance, reinforcement of the status quo) • Harnessing the power of intersectoral and citizen-led public work • Defining standards and values for judgment • Others…
Essential Elements for System Change VenturesLimitations of Conventional Alternatives
Essential Elements for System Change VenturesLimitations of Conventional Alternatives
Essential Elements for System Change VenturesLimitations of Conventional Alternatives
Essential Elements for System Change VenturesLimitations of Conventional Alternatives
Looking Through the Macroscope “A symbolic instrument made of a number of methods and techniques borrowed from very different disciplines…The macroscope filters details and amplifies that which links things together. It is not used to make things larger or smaller but to observe what is at once too great, too slow, and too complex for our eyes.” Can SD simulation models provide practical macroscopes for planning and evaluating health policy? -- Joèl de Rosnay Rosnay Jd. The macroscope: a book on the systems approach. Principia Cybernetica, 1997. <http://pespmc1.vub.ac.be/MACRBOOK.html
System Dynamics Was Developed to Address Problems Marked By Dynamic Complexity Origins • Jay Forrester, MIT, Industrial Dynamics, 1961 (“One of the seminal books of the last 20 years.” -- NY Times) • Public policy applications starting late 1960s • Population health applications starting mid-1970s Good at Capturing • Differences between short- and long-term consequences of an action • Time delays (e.g., developmental period, time to detect, time to respond) • Accumulations (e.g., prevalences, resources, attitudes) • Behavioral feedback (e.g., reactions by various actors) • Nonlinear causal relationships (e.g., threshold effects, saturation effects) • Differences or inconsistencies in goals/values among stakeholders Sterman JD. Business dynamics: systems thinking and modeling for a complex world. Boston, MA: Irwin McGraw-Hill, 2000. Homer JB, Hirsch GB. System dynamics modeling for public health: background and opportunities. American Journal of Public Health 2006;96(3):452-458.
AJPH Systems Issue Science Seminars and Professional Development Efforts SD Identified as a Promising Methodology Hygeia’s Constellation CDC Evaluation Framework Recommends Logic Models SDR 50thIssue System Change Initiatives Encounter Limitations of Logic Models and Conventional Planning/Evaluation Methods Syndemics Modeling* Neighborhood Grantmaking Game Diabetes Action Labs* Fetal & Infant Health Obesity Overthe Lifecourse* CVH in Context* Upstream-Downstream Dynamics National Health Economics & Reform Health System Transformation Game* Milestones in the Recent Use of System Dynamics Modeling at CDC 2006 2007 2008 1999 2000 2001 2002 2003 2004 2005 * Dedicated multi-year budget
Learning In and About Dynamic Systems Strategy, Structure, Mental Decision Rules Models Real World • Unknown structure • Dynamic complexity • Time delays • Impossible experiments Virtual World • Known structure • Controlled experiments • Enhanced learning • Implementation • Game playing • Inconsistency • Short term • Selected • Missing • Delayed • Biased • Ambiguous Information Decisions Feedback • Inability to infer dynamics from mental models • Misperceptions • Unscientific • Biases • Defensiveness Sterman JD. Learning in and about complex systems. System Dynamics Review 1994;10(2-3):291-330. Sterman JD. Business dynamics: systems thinking and modeling for a complex world. Boston, MA: Irwin McGraw-Hill, 2000.
A Model Is… It helps us understand, explain, anticipate, and make decisions “All models are wrong, some are useful.” -- George Box An inexact representation of the real thing
Simulations for Learning in Dynamic Systems Dynamic Hypothesis (Causal Structure) Plausible Futures (Policy Experiments) Obese fraction of Adults (Ages 20-74) 50% 40% 30% Fraction of popn 20-74 20% 10% 0% 1970 1980 1990 2000 2010 2020 2030 2040 2050 Multi-stakeholder Dialogue Morecroft JDW, Sterman J. Modeling for learning organizations. Portland, OR: Productivity Press, 2000. Sterman JD. Business dynamics: systems thinking and modeling for a complex world. Boston, MA: Irwin McGraw-Hill, 2000.
Learning In and About Dynamic Systems “In [dynamically complex] circumstances simulation becomes the only reliable way to test a hypothesis and evaluate the likely effects of policies." -- John Sterman Benefits of Simulation • Formal means of evaluating options • Experimental control of conditions • Compressed time • Complete, undistorted results • Actions can be stopped or reversed • Tests for extreme conditions • Early warning of unintended effects • Opportunity to assemble stronger support • Visceral engagement and learning Complexity Hinders • Generation of evidence (by eroding the conditions for experimentation) • Learning from evidence (by demanding new heuristics for interpretation) • Acting upon evidence (by including the behaviors of other powerful actors) Sterman JD. Learning from evidence in a complex world. American Journal of Public Health (in press). Sterman JD. Business Dynamics: Systems Thinking and Modeling for a Complex World. Boston, MA: Irwin McGraw-Hill, 2000.
Tools for Policy Planning & Evaluation Events Time Series Models Describe trends • Increasing: • Depth of causal theory • Robustness for longer-term projection • Value for developing policy insights • Degrees of uncertainty Multivariate Stat Models Identify historical trend drivers and correlates Patterns Dynamic Simulation Models Anticipate new trends, learn about policy consequences, and set justifiable goals Structure
Look Reasonable, But How Much Will it Take, and What’s the Expected Benefit? When? Milstein B, Chapel T, Renault V, Fawcett S. Developing a logic model or theory of change. Community Tool Box, 2002. Accessed April 9, 2003 at <http://ctb.ku.edu/tools/en/section_1877.htm>.
Model Uses and Audiences • Set Better Goals (Planners & Evaluators) • Identify what is likelyand what is plausible • Estimate intervention impact time profiles • Evaluate resource needsfor meeting goals • Support Better Action (Policymakers) • Explore ways of combining policies for better results • Evaluate cost-effectivenessover extended time periods • Increase policymakers’ motivation to act differently • Develop Better Theory and Estimates (Researchers) • Integrate and reconcile diverse data sources • Identify causal mechanisms driving system behavior • Improve estimates of hard-to-measure or “hidden” variables
An (Inter) Active Form of Policy Planning/Evaluation System Dynamics is a methodology to… • Map the salient forces that contribute to a persistent problem; • Convert the map into a computer simulation model, integrating the best information and insight available; • Compare results from simulated “What If…” experiments to identify intervention policies that might plausibly alleviate the problem; • Conduct sensitivity analyses to assess areas of uncertainty in the model and guide future research; • Convene diverse stakeholders to participate in model-supported “Action Labs,” which allow participants to discover for themselves the likely consequences of alternative policy scenarios
Expanding Public Health Science Syndemic Orientation Problems Among People inPlaces Over Time Boundary Critique “Public health imagination involves using science to expand the boundaries of what is possible.” -- Michael Resnick EpidemicOrientation
Boundary Critique Creating a new theory is not like destroying an old barn and erecting a skyscraper in its place. It is rather like climbing a mountain, gaining new and wider views, discovering unexpected connections between our starting point and its rich environment. -- Albert Einstein Ulrich W. Boundary critique. In: Daellenbach HG, Flood RL, editors. The Informed Student Guide to Management Science. London: Thomson; 2002. p. 41-42. <http://www.geocities.com/csh_home/downloads/ulrich_2002a.pdf>. Ulrich W. Reflective practice in the civil society: the contribution of critically systemic thinking. Reflective Practice 2000;1(2):247-268. http://www.geocities.com/csh_home/downloads/ulrich_2000a.pdf
The Weight of Boundary Judgments Forrester JW. Counterintuitive behavior of social systems. Technology Review 1971;73(3):53-68. Meadows DH. Leverage points: places to intervene in a system. Sustainability Institute, 1999. Available at <http://www.sustainabilityinstitute.org/pubs/Leverage_Points.pdf>. Richardson GP. Feedback thought in social science and systems theory. Philadelphia, PA: University of Pennsylvania Press, 1991. Sterman JD. Business dynamics: systems thinking and modeling for a complex world. Boston, MA: Irwin McGraw-Hill, 2000.
Implications for Policy Planning and Evaluation Insights from the Overview Effect • Maintain a particular analytic distance • Not too close to the details, but not too far as be insensitive to internal pressures • Potential to anticipate temporal patterns (e.g., better before worse) • Structure determines behavior • Potential to avoid scapegoating or lionizing Richardson GP. Feedback thought in social science and systems theory. Philadelphia, PA: University of Pennsylvania Press, 1991. Richmond B. Systems thinking: critical thinking skills for the 1990s and beyond. System Dynamics Review 1993;9(2):113-134. Available at <http://www.clexchange.org/ftp/documents/whyk12sd/Y_1993-05STCriticalThinking.pdf>. White F. The overview effect: space exploration and human evolution. 2nd ed. Reston VA: American Institute of Aeronautics and Astronautics, 1998.
Civic Participation Forces Outside the Community • Social cohesion • Responsibility for others • Macroeconomy, employment • Food supply • Advertising, media • National health care • Racism • Transportation policies • Voluntary health orgs • Professional assns • University programs • National coalitions Health Care & Public Health Agency Capacity • Provider supply • Provider understanding, competence • Provider location • System integration • Cost of care • Insurance coverage Personal Capacity Local Living Conditions • Understanding • Motivation • Social support • Literacy • Physio-cognitive function • Life stages • Availability of good/bad food • Availability of phys activity • Comm norms, culture (e.g., responses to racism, • acculturation) • Safety • Income • Transportation • Housing • Education Health Care Utilization • Ability to use care (match of patients and providers, language, culture) • Openness to/fear of screening • Self-management, monitoring Metabolic Stressors • Nutrition • Physical activity • Stress Population Flows • Percent of patients screened • Percent of people with diabetes under control • Baseline Flows We Convened a Model-Scoping Group of 45 CDC professionals and epidemiologists in December 2003 to Explore the Full Range of Forces Driving Diabetes Behavior over Time
Diabetes Model Overview Burden of Diabetes Costs (per person with diabetes) Total Prevalence Unhealthy Days (people with diabetes) (per person with diabetes) Developing Prediabetes Diabetes People with Deaths People with Diagnosis People with Onset Onset People with Normal e Undiagnosed Diagnosed a b c Prediabetes Blood Sugar Diabetes Diabetes Levels Recovering from Prediabetes Deaths Obesity in the Prediabetes Diabetes Diabetes General Detection & Detection Management Population Management Developing d Data sources: NHIS, NHANES, BRFSS, Census, Vital statistics, Clinical studies, Cost studies
Diabetes Model Overview Burden of This larger view takes us beyond standard epidemiological models and most intervention programs Diabetes Costs (per person with diabetes) Total Prevalence Unhealthy Days (people with diabetes) (per person with diabetes) PreDiabetes People with Deaths People with Diagnosis People with Onset Normal e Undiagnosed Diagnosed a b Blood Sugar Diabetes Diabetes Levels Recovering from PreDiabetes Deaths Obesity in the Prediabetes Diabetes Diabetes General Detection & Detection Management Population Management Standard boundary Developing Developing Diabetes Onset People with c Prediabetes d Data sources: NHIS, NHANES, BRFSS, Census, Vital statistics, Clinical studies, Cost studies
Expanding Public Health Science Syndemic Orientation Governing Dynamics CausalMapping Dynamic Modeling Problems Among People inPlaces Over Time Plausible Futures Boundary Critique “Public health imagination involves using science to expand the boundaries of what is possible.” -- Michael Resnick EpidemicOrientation
Selected CDC Projects Featuring System Dynamics Modeling (2001-2008) • Grantmaking ScenariosTiming and sequence of outside assistance • Upstream-Downstream EffortBalancing disease treatment with prevention/protection • Healthcare ReformRelationships among cost, quality, equity, and health status • Chronic Illness DynamicsHealth and economic scenarios for downstream and upstream reforms • SyndemicsMutually reinforcing afflictions • DiabetesIn an era of rising obesity • ObesityLifecourse consequences of changes in caloric balance • Infant HealthFetal and infant morbidity/mortality • Heart Disease and StrokePreventing and managing multiple risks, in context Milstein B, Homer J. Background on system dynamics simulation modeling, with a summary of major public health studies. Atlanta, GA: Syndemics Prevention Network, Centers for Disease Control and Prevention; February 1, 2005. <http://www2.cdc.gov/syndemics/pdfs/SD_for_PH.pdf>.
Preventing and Managing Risk Factors for Heart Disease and Stroke Modeling the Local Dynamics of Cardiovascular Health Homer J, Milstein B, Wile K, Pratibhu P, Farris R, Orenstein D. Modeling the local dynamics of cardiovascular health: risk factors, context, and capacity. Preventing Chronic Disease (in press).
What is best allocation of resources to eliminate the burden, disparity & costs of preventable CVD, recognizing the spectrum of opportunities in particular places & settings? Over what time frame? Guiding Questions
Core Design Team CDC: Michele Casper, Rosanne Farris, Darwin Labarthe, Marilyn Metzler, Bobby Milstein, Diane Orenstein Austin: Cindy Batcher, Karina Loyo, Ella Pugo, Rick Schwertfeger, Adolfo Valadez, Josh Vest, NIH: David Abrams, Patty Mabry Consultants: Jack Homer, Justin Trogdon, Kristina Wile Contributors Organizational Sponsors • Austin/Travis County Health and Human Services Department • CDC Division for Heart Disease and Stroke Prevention • CDC Division of Adult and Community Health • CDC Division of Nutrition, Physical Activity, and Obesity • CDC Division of Diabetes Translation • CDC Office on Smoking and Health • CDC NCCDPHP Office of the Director • Indigent Care Collaborative (Austin, TX) • NIH Office of Behavioral and Social Science Research • RTI International • Sustainability Institute • Texas Department of Health
Model Purpose and Rationale • Purpose • How do multiple risk factors and social factors combine to affect cardiovascular disease (CVD) endpoints and costs? • How should we focus our policy efforts given limited resources? • Rationale for systems modeling • Capturing intermediate links so that possible “confounding factors” are included explicitly rather than ignored • Non-additive effects when multiple risk factors are combined • Time delays from change in incidence to change in prevalence (accumulation or “bathtub” effects) The model described here is a work in progress funded by the CDC’s Division of Heart Disease and Stroke Prevention. We plan to finalize the model’s equations and parameter values by February 2008.
Intervention Approaches from “Upstream” to “Downstream” Our model focuses on the prevention and control of risk factors that can lead to a first-time CVD event.
Crafting Effective Intervention Strategies for Upstream Prevention in Context • Concentrate on “upstream” challenge of minimizing risk, rather than the better understood “downstream” task of post-event care • Local conditions affect people’s health status and their responses to perceived problems • Local social and physical factors may be critical when characterizing the history—and plausible futures—of cardiovascular disease in a given city or region • These aspects of local context are difficult to measure and too often excluded when planning and evaluating policies or programs The CDC is partnering on this project with the Austin (Travis County), Texas, Dept. of Health and Human Services. The model is calibrated to represent the overall US, but is informed by the experience and data of the Austin team, which has been supported by the CDC’s “STEPS” program since 2004.
Local capacity for leadership & organizing LOCAL ACTIONS COSTS (CVD & NON-CVD) NUTRITION, PHYSICAL ATTRIBUTABLE TO RISK FACTORS ACTIVITY & STRESS • Salt intake • Saturated/Trans fat intake • Fruit/Vegetable intake • Net caloric intake • Physical activity • Chronic stress LOCAL CONTEXT • Eating & activity options • Smoking policies • Socioeconomic conditions • Environmental policies • Health care options • Support service options • Media and events RISK FACTOR ONSET, PREVALENCE & CONTROL • Hypertension • High cholesterol • Diabetes • Obesity • Smoking • Secondhand smoke • Air pollution exposure Modified Anderson Risk Calculator UTILIZATION OF SERVICES ESTIMATED FIRST-TIME FATAL AND NON-FATAL CVD EVENTS • Behavioral change • Social support • Mental health • Preventive health • CHD (MI, Angina, Cardiac Arrest) • Stroke • Total CVD (CHD, Stroke, CHF, PAD) Preventing and Managing Risk Factors for CVDSector Diagram Homer J, Milstein B, Wile K, Pratibhu P, Farris R, Orenstein D. Modeling the local dynamics of cardiovascular health: risk factors, context, and capacity. Preventing Chronic Disease in press. DRAFT: October, 2007
Data Sources for CVD Risk Modeling • Census • Population, deaths, births, net immigration, health coverage • AHA & NIH statistical reports • CVD events, deaths, and prevalence (CHD, stroke, CHF, PAD) • National Health and Nutrition Examination Survey (NHANES) • Risk factor prevalences by age (18-29, 30-64, 65+) and sex (M, F) • Risk factor diagnosis and control (hypertension, high cholesterol, diabetes) • Behavioral Risk Factor Surveillance System (BRFSS) • Diet & physical activity • Primary care utilization • Lack of needed emotional/social support • Research literature • CVD risk calculator, and relative risks from SHS, air pollution, obesity, and inactivity • Medical and productivity costs of CVD and risk factors • Questionnaires for CDC and Austin teams (expert judgment) • Potential effects of social marketing • Potential effects of expanded access to healthy food, activity, and behavioral services • Effects of behavioral services on smoking, weight loss, stress reduction • Relative risks of stress for high BP, high cholesterol, smoking, and obesity
Developing a “Status Quo” Scenario Obese % of non-CVD popn • A straightforward base case • Assume no changes after 2000 in contextual factors or in risk factor inflow/outflow rates • Any changes in risk prevalences after 2000 are due to “bathtub” adjustment and population aging • Result: Past trends continue after 2000, but decelerate and level off • Increasing obesity, high BP, and diabetes • Decreasing smoking • High cholesterol mixed bag by age and sex, flat overall Uncontrolled hypertension % of non-CVD popn Smoking % of non-CVD popn The model is calibrated to reproduce data from NHANES 1988-94 and 1999-2004 on risk factor prevalences in the non-CVD population by age and sex.