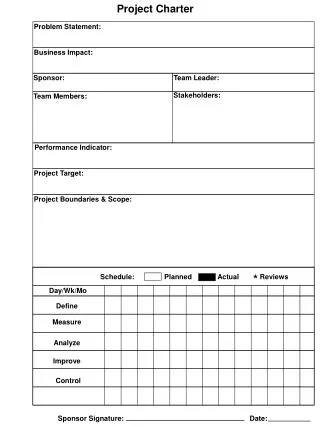

Project Charter
E N D
Presentation Transcript
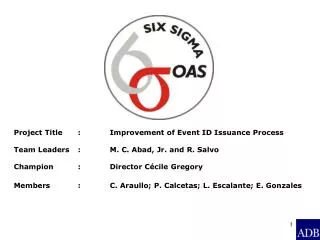
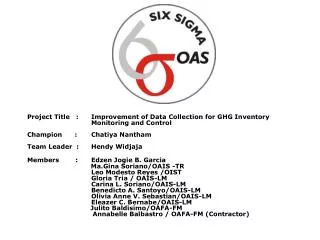
Project Title : Improvement of Data Collection for GHG Inventory Monitoring and ControlChampion : Chatiya NanthamTeam Leader : Hendy WidjajaMembers :Edzen Jogie B. Garcia Ma.Gina Soriano/OAIS -TRLeo Modesto Reyes /OIST Gloria Tria / OAIS-LM Carina L. Soriano/OAIS-LM Benedicto A. Santoyo/OAIS-LM Olivia Anne V. Sebastian/OAIS-LM Eleazer C. Bernabe/OAIS-LM Julito Baldisimo/OAFA-FM Annabelle Balbastro / OAFA-FM (Contractor)
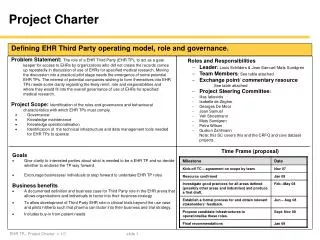
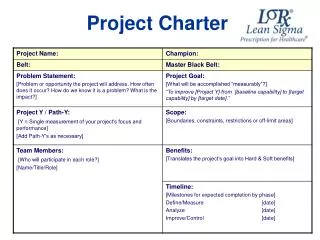
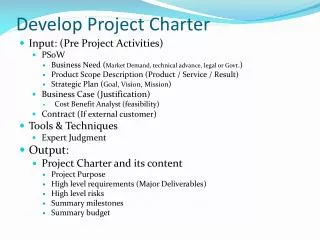
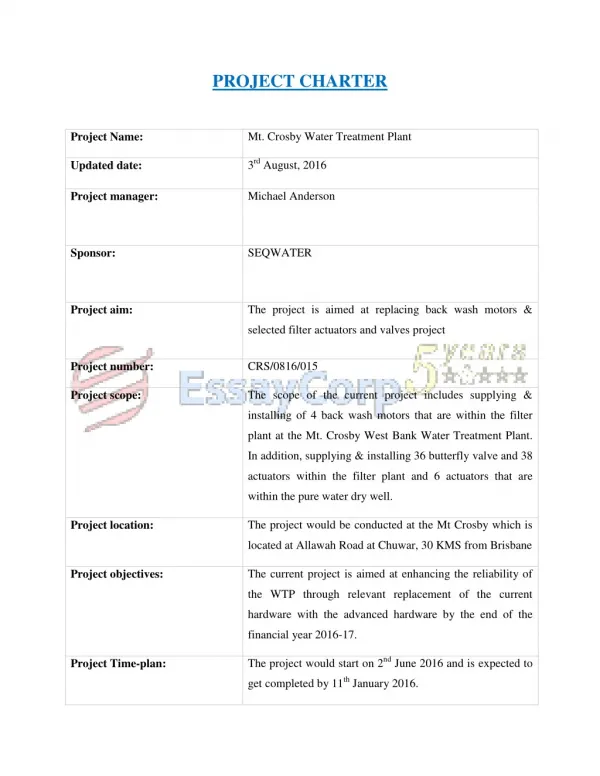
Project Charter Business Case As part of Asian Development Bank (ADB) initiative in promoting environmentally sustainable economic development, ADB has consider climate change issue seriously. One of the primary concerns that ADB is addressing is the need to reduce the level of emission of greenhouse gases (GHG) which has been attributed as the primary cause of global warming. The first Greenhouse Gas (GHG) Inventory Mapping Study was initiated in October 2007. The inventory covers direct and indirect emissions from the operations of ADB HQ for the calendar years 2005 and 2006. The study was able to accomplish a complete inventory of the direct emissions for the covered years. The inventory for indirect sources was not completed due to data gathering constraints. The study suggested the completion of inventory for 2005 and 2006 indirect emission sources and implementation of 2007 GHG inventory to establish GHG emission reduction target for 2008 and 2009 . However, the GHG Inventory Team has limited time and resources to complete the emission data. This project aims to improve data collection system that allows ADB to complete its GHG inventory in less time, in less cost and with less errors resulting to a simple process that gives out high quality information.
DEFINE • Problem Statement: • The GHG activity data was not readily available and significant time was needed to extract the required for GHG emission calculation. • Activity data needed to calculate emissions from business travel, postage and freight of ADB documents and shipment of goods for ADB Staff was incomplete. The original tracking scheme requires additional resources to estimate distances between ports and air travel , a tedious and time-consuming process. • Project Goals: • 1. To complete GHG Inventory from 2005 to 2008 first quarter by May 2008. • 2. To improve data collection system by streamlining data gathering process and build a computer application with a custom designed database to minimize errors and obtain high quality information.
ANALYZE Revised CTQ
ANALYZE CASE STUDY: 2006 TRAVEL DATA This should be 5,001.56 (3% higher)
ANALYZE CASE STUDY: 2006 TRAVEL DATA • The 3% difference is within CTQ, however the following discrepancies in detail data submissions did not meet the CTQ • For the sample, distance between Philippine and Hong Kong are not consistent: • It ranges from 216km to 13,687km; • There are 3 blank fields for distances; • In comparison with the actual distances of 1,116km, the total variances for 112 PHI HKG trips is 222,260km or on average is 1,984km more per trip.
ANALYZE CASE STUDY: 2006 TRAVEL DATA • Quick look of other variances: Actual distance of PHI - VIE is 1,751km Actual distance of PHI - CAM is 1,776km
ANALYZE CASE STUDY: 2006 TRAVEL DATA • Quick look of other variances: Actual distance of PHI - VIE is 1,751km
ANALYZE CASE STUDY: 2006 TRAVEL DATA • Quick look of other variances: Actual distance of THA - LAO is 525km
ANALYZE CASE STUDY: 2006 TRAVEL DATA • There are 3,465 or 49.94% that do not meet the CTQ target of 95% data accuracy. • Detailed analysis: • The original CO2 calculation by GHG consultant based on the data provided by the users unit is 4,857ton CO2, the corrected CO2 calculation indicates 5,001ton CO2 or 3% higher – meet the CTQ; • Based on the master distance table developed independently: • 2,587 of 6,938 travel data or 37.29% has ZERO variance, this means the distance data was correctly recorded then the CO2 emission was also correctly calculated - meet the CTQ, • 886 records (12.77%) differ between -5 to 5% of the actual distances listed in the master table - meet the CTQ, • however 3,465 records or 49.94% have variances greater than 5%, ranging from -100 to 8,221% of the actual distances (39 records without distances) – did not meet the CTQ.
ANALYZE CASE STUDY: 2006 TRAVEL DATA Variances may result from the causes listed below PEOPLE METHODS LACK OF AWARENESS OF GHG IMPACT ERRORS IN DATA ENTRY ENVIRONMENT LACK OF MANPOWER DATA NOT NEEDED IN OPERATION N/A NO SYSTEM COMPATIBLE WITH GHG AWARENESS NO PROPER TRAINING DATA COLLECTION ISSUES N/A UNAVAILABILITY OF DATA NO QA/QC INCOMPLETE INFORMATION MACHINE WRONG DATA ENTRY MEASUREMENT SOURCE DOCUMENTS
ANALYZE CASE STUDY: 2006 TRAVEL DATA Further, the GHG data collection consumed many staff/consultants hours Sample distances: GHG calculation for Manila – New Delhi - Manila An estimated total of 20 staff-days to complete the calculation, based on approximately 350 records per day. 6,949 Point to Point Destination
ANALYZE CASE STUDY: 2006 TRAVEL DATA Inventory Limitations and Improvements Needed (Based on Consultant’s GHG Inventory Report) 2005 and 2006 Inventory Improvements Needed Airport names and cities of countries and origin and destination were difficult to extract because they are not electronically accessible yet. To estimate air travel distances, pre-selected cities/airports of countries of origin and destination were used which can cause variation. - It is recommended that ADB expand its business travel documentation procedures (electronically) for GHG Inventory. - Eliminate the cause of variation. Air Travel
IMPROVE Completed Actions to improve Data Collection
IMPROVE CASE STUDY: 2007 TRAVEL DATA Data collection process is re-engineered, to achieve CTQ target of 95% accuracy and completeness • Data download: once the procedure is in place, OIST can directly provide the data to us. However, data owner needs to approve the process and endorse the data validity • Data processing: The tool (IDEA data analysis) will automatically analyze the data and generate the reports, i.e. table for missing air travel distance to be completed by GHG staff, periodic report on CO2 emission per traveling staff • Result dissemination: Based on the discussion with others, report will be distributed for monitoring or reducing CO2 emissions.
IMPROVE CASE STUDY: 2007 TRAVEL DATA Master Table for Distance Travel that will require only minor update when we process subsequent year data, out of 1744 distances in 2007, 2008 may only have about 300 new unique distances AIR TRAVEL 2007 DATA EXTRACTED FROM MAINFRAME 1744 Unique Point to point Destination Manual input of Distance for 18,367 Point to point Destination
IMPROVE CASE STUDY: 2007 TRAVEL DATA IDEA generates Script that can be customized – this script import the data to IDEA, analyze them and generate report
IMPROVE CASE STUDY: 2006 TRAVEL DATA ACHIEVING CTQ TARGET OLD PROCESS 50% meet CTQ (CTQ: 95% data accuracy and completeness) NEW PROCESS 100% meet CTQ The Master Distance Table developed by the GHG team went through rigorous checking procedures. Distances obtained from various websites are compared to improve consistency. The table was imported to IDEA to automate CO2 emission calculation. (CTQ: 95% data accuracy and completeness)
IMPROVE CASE STUDY: 2007 TRAVEL DATA Sample distances: GHG calculation for Manila – New Delhi - Manila An estimated total of 19 staff-days require to develop the distance table (17.5 days for completing 1744 segment-to-segment destinations) and 1.5 days to complete the automatic calculation. 18,367 Point to Point Destination
IMPROVE CASE STUDY: 2007 TRAVEL DATA IMPROVE PROCESS = CUT COST NO. OF REQUIRED STAFF DAYS TO FINISHED THE TASK OLD PROCESS 18,367 Point to Point Destination 53 STAFF DAYS Rate : 350 Distances / day NEW PROCESS 19 STAFF DAYS Using old process, the calculation requires approximately 34more days or 178.95 % more time than using new process
IMPROVE CASE STUDY: 2007 TRAVEL DATA $177 cost per day refers to the charge rate of the first GHG consultant engaged to calculate CO2 emission. With the intensity of many activities during the manual data collection, many staff require external resources to assist. OLD PROCESS NO. OF REQUIRED STAFF DAYS TO FINISHED THE TASK RATE PER DAY $ 177.00 = $ 9381.00 X 53 STAFF DAYS In addition to achieving CTQ (95% data accuracy and completeness), saving was obtained in the current process to calculate CO2 emission for 2007 data NEW PROCESS $ 177.00 = $ 3363.00 19 STAFF DAYS X $ 6,018.00 SAVINGS :
IMPROVE 2007 POSTAGE AND FREIGHT DATA REPLICATION OF IMPROVED PROCESS TO POSTAGE AND FREIGHT NO. OF REQUIRED STAFF DAYS TO FINISHED THE TASK OLD PROCESS POSTAGE AND FREIGHT DATA Rate : 350 Distances / day 11,563 Point to Point Destination 33 STAFF DAYS Rate : 200 Distances / day NEW PROCESS + 12 Staff Days 1.5 Staff Days 2,393 Unique Point to Point Destination 13.5 STAFF DAYS Using old process, the calculation requires approximately 19.5more days or 244 % more time than using new process
IMPROVE 2007 SHIPMENTS OF GOODS DATA REPLICATION OF IMPROVED PROCESS TO SHIPMENT OF GOODS (Inbound and Outbound) NO. OF REQUIRED STAFF DAYS TO FINISHED THE TASK OLD PROCESS SHIPMENT OF GOODS (Inbound and Outbound) Rate : 80 Distances / day 1,194 Point to Point Destination 15 STAFF DAYS Rate : 80 Distances / day NEW PROCESS 2.5 Staff Days 1.5 Staff Days + 181 Unique Point to Point Destination 4 STAFF DAYS Using old process, the calculation requires approximately 11more days or 375 % more time than using new process
IMPROVE CURRENT SAVINGS Less Savings obtained for the first year as master table are set for the first time for 2007 Data.
IMPROVE FUTURE SAVINGS to process 2008, 2009, 2010 Data Savings Projection for Three Years (the project may continue after, by that time there may be a better solution to calculate GHG Inventory) Assumption for updating Master Table data: Additional 300 unique destination / year (Air Travel and Postage and Freight) Additional 40 unique destination / year (Shipment of Goods)
IMPROVE NET SAVINGS to Calculate 2007, 2008, 2009 & 2010 Data Savings for 2007 Data Processing $ 11,416.50 $ 48,586.50 Savings for 3 subsequent years Gross Savings $ 60,030.00 Less : Cost of IDEA Software $ 3,000.00 Less : Cost of IDEA annual helpdesk support ($3000 per year) $ 9,000.00 Net Savings $ 48,003.00
CONTROL NEXT STEPS • Procure the software • Train the GHG team • Replicate the effort done by Six Sigma for calculating 2008 data for Q2, Q3 and Q4 • Monitor the implementation for continuous improvement until end of 2008 – end of six sigma project • Institutionalize the procedure for processing future data: 2009 onward • Review this process again in 2011 – future six sigma project ?