Download
1 / 21
330 likes | 976 Views
The Science of CPR. Many thanks to Dr. Kudenchuk for sharing his slides. CPR Prior to Shock First rhythm VF; n=1117. 50 40 30 20 10 0. p=0.04. “CPR first” 1994-96, n=478. % Survival. “Shock first” 1990-93, n=639. 1 2 3 4 5 >5.

E N D
The Science of CPR Many thanks to Dr. Kudenchuk for sharing his slides
CPR Prior to Shock First rhythm VF; n=1117 50 40 30 20 10 0 p=0.04 “CPR first” 1994-96, n=478 % Survival “Shock first” 1990-93, n=639 1 2 3 4 5 >5 1st Unit Arrival Interval (min) 1990-93 n=22 91 205 164 86 71 1994-96 n=14 80 164 114 65 41 Cobb LA et al. JAMA 1999;281:1182-1188
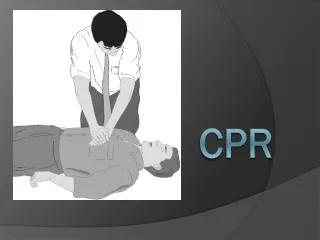
Compression • Increased intrathoracic pressure • Ejects blood from heart and lungs • “Good” compression increases forward output and BP • Decompression (recoil) • Decreased intrathoracic pressure • Refilling of heart and lungs • “Good” recoil vacuum refillingforward output
Hemodynamics of CPR Compression (“systole”) mm Hg Decompression (“diastole”) 60 RT ATRIUM Aorta 40 Organ perfusion Heart + organ perfusion 0 EXTRATHORAIC VEINS LEFT VENTRICLE RT ATRIUM Criley JM et al. Circulation 1986;74(IV):42-50.
Coronary Perfusion Pressure and ROSC in Human CPR n=100 patients with cardiac arrest 100% 80% 57% 50% 55+ (normal) 40-45 25-39 No ROSC n= 76 CorPP 8.4±10 mm Hg ROSC n=24 CorPP 25.6±7.7 mm Hg 36% 20-24 Coronary perfusion pressure (CorPP) Coronary perfusion pressure (CorPP) 15-19 0% 0-14 *CorPP = Aorta – RA pressure gradient during relaxation (diastolic) phase of precordial compression Paradis NA., et al. JAMA 1990;263:1106-1113
n = 60 consecutive VF resuscitations/shock • 63% men, 65 y/o • Time to 1st shock = 3.7min • Measurements • Compression depth = mm during 30 sec before 1st shock • Outcomes • Successful shock = VF terminated ≥ 5 sec • ROSC = organized rhythm/pulse/BP ≥ 20 min Edelson DP et al. Resuscitation 2006;71:137-45
Effect of CC Depth on Shock Success ORadj*1.99/↑5 mm compression depth (95%CI 1-08-3-66, p=0.028) *Arrest location, age, sex, time-to-shock † † AHA recommendations 1.5-2” (4-5 cm) Edelson DP et al. Resuscitation 2006;71:137-45
The Price of CPR Pauses 30 compressions Aorta RA 16 secs 3 secs CPR “systole” CPR “diastole” Paused CPR
CPR Performance: Observed vs Perceived n=30 (19 EMTs, 11 Paramedics) Manikin study 90% (88-90) 82% (75-90) 80% (75-90) 75% (70-90) (25th-75th quartiles) (50/50) Correct CPR Performance Parameters Aufderheide TP et al. Resuscitation 2005;64:353-62
CPR Performance: Observed vs Perceived n=30 (19 EMTs, 11 Paramedics) Manikin study NSD 99% (85-100) p=0.002 p=0.01 p=0.02 90% (88-90) 82% (75-90) 80% (75-90) 75% (70-90) 47% (42-48) (25th-75th quartiles) 26% (24-57) 8% (7-60) (50/50) Correct CPR Performance Parameters Aufderheide TP et al. Resuscitation 2005;64:353-62
n=176 adults with out-of-hospital cardiac arrest • Automated resuscitation monitoring • Compression rate, depth, “hands off” time • Ventilation rate • ECG • Events Wik L et al JAMA 2005;293:299-304
Quality of CPR During Out-of-Hospital Cardiac Arrest n=176 Vs AHA Guidelines chest compression 100 ± 10/min (75 @ 30:2) Vs AHA Guidelines compression depth 38-52 mm (1.5-2”) 60 25 64 23 49% 21 48% 18 34 9 35 10 ~12% @ 30:2 † * † % time without spontaneous circulation or chest compressions *Average # compressions given per minute vs instantaneous rate at which compressions, when given, were administered (120 20) Wik L et al JAMA 2005;293:299-304
20 instrumented swine • 7 minutes of unsupported VF CPR + AED “Hands-off” interval prior to each shock (mimicking analysis and charge interval of AEDs (10-19secs)) 3 secs 10 secs 15 secs 20 secs Yu T et al. Circulation 2002;106:368-372
Effect of Interrupted Precordial Compression on Resuscitation Outcome Successfully Resuscitated p<0.01 p<0.05 100% p<0.05 80% 40% 0 Seconds of Interrupted CPR n=5 per group Yu T et al. Circulation 2002;106:368-372
n=9 instrumented swine • 6 minutes untreated VF standard CPR* x 3 min CPR with 75% • recoil (residual 1.2 cm sternal compression @ end decompression) • x 1 min standard CPR* x 1 min defib x 3 ACLS *Standard CPR = CC @100/min, 50% duty cycle, 5 cm depth, full (100%) recoil, 15:2 ratio Yannopoulos D et al. Resuscitation 2005;64:363-72
Effect of Incomplete Chest Decompression On Coronary and Cerebral Perfusion Pressures n=9 instrumented swine std CPR (100% recoil) x 3’ CPR (75% recoil) x 1’ *† *† p<0.05 % Chest recoil † * * p<0.05 * mm Hg Critical pressure for ROSC * † * *(Ao Diastolic-RAP) †(MAP – mean ICP pressure) Yannopoulos D et al. Resuscitation 2005;64:363-72; Paradis et al JAMA 1990;263:3257-8
New Protocol Importance of High-PerformanceResuscitation Percent Survival from Witnessed VF Rhythm 60 50 40 48% percentsurvival 30 35% 20 10 0 2000 - 2004 2005 - 2009
Take home points • Quality of CPR is critical • Rate • Depth • Recoil • High Density CPR(also ‘high performance CPR’) • Achieved with a carefully choreographed approach • Chest compressions must occur 90% of the time
Annual Utstein Survival for Chelan/Douglas Counties *Incomplete data for 2010