Download
1 / 28
280 likes | 403 Views
Heat and freshwater budegts, fluxes, and transports. Reading: DPO Chapter 5. Polar. shortwave radiation. longwave. shortwave radiation. longwave. 450Wm -2. 250Wm -2. 150Wm -2. 150Wm -2. 200Wm -2. 50Wm -2. atmosphere. atmosphere. evaporation. evaporation. -100Wm -2. -50Wm -2.

E N D
Heat and freshwater budegts, fluxes, and transports Reading: DPO Chapter 5
Polar shortwave radiation longwave shortwave radiation longwave 450Wm-2 250Wm-2 150Wm-2 150Wm-2 200Wm-2 50Wm-2 atmosphere atmosphere evaporation evaporation -100Wm-2 -50Wm-2 225Wm-2 -100Wm-2 -50Wm-2 ocean 75Wm-2 ocean Net heat flux (gain) 75Wm-2 Net heat flux (loss) -75Wm-2 Heat budgets, fluxes, transports Tropics
This imbalance needs to be compensated by transporting heat poleward in atmosphere and ocean. Total (atmosphere + ocean) ≈ 6 PW (1 PW = 1015 J/s) (can be determined just from satellite radiation observations). Atmospheric measurements allow estimate of atmospheric part: 4PW, so total ocean “meridional” heat transport 2 PW (no ocean observations needed for this….)
Total (atmosphere+ocean) global heat transport versus latitude
top area A Qsurface side area S volume V u2 h1 side area S u1 Q2 h2 Q1 Simple heat budget example Heat content H= cp T ρ V [J] per volume h= cp T ρ [J/m3] Heat flux Q = heat/time/area W/m2 may be radiation like Qsurface, or water transporting heat like Q1 = u1 h1 Heat transport F = Q x area [W] ΔH/ Δt= ρ cp V ΔT/ Δt = Qsurface A + Q1 S – Q2 S (*) Surface heat flux divergence of ocean heat transport
Can calculate ocean heat transports F from only surface flux data : Q2=-50W/m2 Q3=+50W/m2 Q1=-50W/m2 A1 A2 A3 F1=-Q1A1 F2=-Q1A1-Q2A2 F3=-Q1A1-Q2A2-Q3A3
Or from oceanic measurements of currents v and temperature T everywhere… over a section across the ocean. Heat transport = H = cpTviAi = cpTvdAJ/sec=W CARE is necessary to balance the MASS first. If more water flows INTO a volume than OUT, then the heat/temperature equation like (*) earlier has a term like(uout-uin) T which can give an arbitrary (possibly HUGE) error depending on choice of temperature scale (e.g. Celsius vs. Kelvin)
Heat and heat transportSurface heat flux (W/m2) into ocean DPO Figure 5.16
Ocean heat balance, including radiation Qsfc= Qs + Qb+ Qh + Qe Total surface heat flux = Shortwave + Longwave + Latent + Sensible
Ocean heat balance, including radiation Qsfc= Qs + Qb+ Qe + Qh Total surface heat flux = Shortwave + Longwave + Latent + Sensible This diagram shows a net global balance, not a local balance
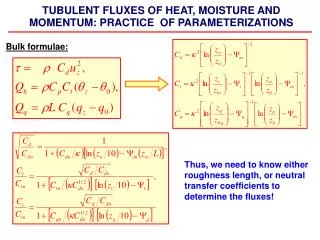
Ocean heat balance Qsfc= Qs + Qb + Qe + Qh in W/m2 Shortwave Qs: incoming solar radiation - always warms. Some solar radiation is reflected. The total amount that reaches the ocean surface is Qs = (1-)Qincoming where is the albedo (fraction that is reflected). Albedo is low for water, high for ice and snow. C monthly mean fractional cloud cover, θN is the noon solar elevation. (So-called “bulk formulas”)
Ocean heat balance Qsfc= Qs + Qb + Qe + Qh in W/m2 Longwave Qb: outgoing (“back”) infrared thermal radiation (the ocean acts nearly like a black body) - always cools the ocean C monthly mean fractional cloud cover, T is air and water temperature,e water vapour pressure, k an empirical cloud cover coefficient,ε emittance of the sea surface, σSb Stefan-Boltzmann constant.
Ocean heat balance Qsfc= Qs + Qb + Qe + Qh in W/m2 Latent Qe: heat loss due to evaporation - always cools. It takes energy to evaporate water. This energy comes from the surface water itself. (Same as principal of sprinkling yourself with water on a hot day - evaporation of the water removes heat from your skin) Ce transfer coefficient for latent heat, u wind speed at 10m height,qs is 98% of saturated specific humidity, qa is actual specific humidity, L is latent heat of evaporation.
Ocean heat balance Qsfc= Qs + Qb + Qe + Qh in W/m2 Sensible Qh : heat exchange due to difference in temperature between air and water. Can heat or cool. Usually small except in major winter storms. Ch transfer coefficient for sensible heat, u wind speed at 10m height,T is surface water and air temperature, γ is adiabatic lapse rate of air and z the height where Ta is measured.
Annual average heat flux components (W/m2) DPO Figure 5.15
Heat flux components summed for latitude bands (W/m2) DPO Figure 5.17
Heat transport Heat input per latitude band (PW) 1 PW = 1 “Petawatt” = 1015 W Heat transport (PW) (meridional integral of the above) DPO Figure 5.24
Heat transport • Meridional heat transport across each latitude in PW • Calculate either from atmosphere (net heating/cooling) and diagnose for ocean • OR from velocity and temperature observations in the ocean. Must have net mass balance to compute this. DPO Figure 5.23
Transport definitions • Transport: add up (integrate) velocity time property over the area they flow through (or any area - look at velocity “normal” to that area) • Volume transport = integral of velocity v m3/sec • Mass transport = integral of density x velocity v kg/sec • Heat transport = integral of heat x velocity cpTv J/sec=W • Salt transport = integral of salt x velocity Sv kg/sec • Freshwater transport = integral of Fwater x velocity (1-S)v kg/sec • Chemical tracers = integral of tracer concentration (which is in mol/kg) x velocity Cv moles/sec • Flux is just these quantities per unit area
Transport definitions • Volume transport = V = viAi = vdA m3/sec • Mass transport = M = viAi = vdAkg/sec • Heat transport = H = cpTviAi = cpTvdAJ/sec=W • Salt transport = S = SviAi = SvdA kg/sec • Freshwater transport = F = (1-S) viAi = (1 - S)vdA kg/sec • Chemical tracers = C = CviAi = CvdA moles/sec • Flux is just these quantities per unit area e.g. volume flux is V/A, mass flux is M/A, heat flux is H/A, salt flux is S/A, freshwater flux is F/A, C /A
Conservation of volume, salt • volume conservation: Vo - Vi = (R + AP) – AE F (total of freshwater inputs over basin) (2) Salt conservation: ViρiSi = VoρoSo or approximately ViSi = VoSo
Combining these equations gives Vi = F So / ΔS Vo = F Si / ΔS or approximately (Vi≈ Vo V , Si≈ So S) V = F S / ΔS “Knudsen relations”. Useful for calculating transport/influx/outflux from F and S, or for estimating F from flow measurements…. Note what happens when ΔS becomes very small (“overmixed” case….)
Mediterranean and Black Seas Evaporative basin Runoff/precipitation DPO Figure 5.3
NCEP climatology Precipitation minus evaporation (cm/yr):what freshwater transports within the ocean are required to maintain a steady state salinity distribution in the ocean given this P-E? • Consider N. Pacific box, Bering Strait to north, complete east-west crossing between net P and net E areas, for example • Total freshwater transport by ocean out of this box must equal the P-E • FW transport across the long section must equal take up all the rest of the net P-E in the area to the north, after Bering Strait is subtracted
Global ocean freshwater transport Wijffels (2001) • Continuous curves show different estimates of ocean FW transport based on observed P-E+R (atmosphere and rivers) • Diamonds with error bars are estimates of FW transports based on ocean velocities and salinities
Freshwater transport divergences from velocity&salinity observations.Blue/positive means is net precipitation, red/negative net evaporation. Arrows/color show circulation and relative salinity being transported