Download
1 / 6
60 likes | 194 Views
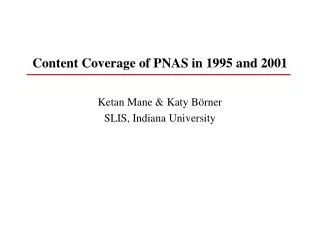
Content Coverage of PNAS in 1995 and 2001. Ketan Mane & Katy B ö rner SLIS, Indiana University. Statistics for the two time slices * Features 1995 2001 Number of documents 2505 2708 Number of unique keywords 14408 15269 Max. number of times cited 1447 155

E N D
Content Coverage of PNAS in 1995 and 2001 Ketan Mane & Katy Börner SLIS, Indiana University
Statistics for the two time slices * Features 1995 2001 Number of documents 2505 2708 Number of unique keywords 14408 15269 Max. number of times cited 1447 155 * Used author and publisher assigned keywords and controlled vocabulary Mesh terms from Medline Content Coverage of PNAS in 1995 and 2001
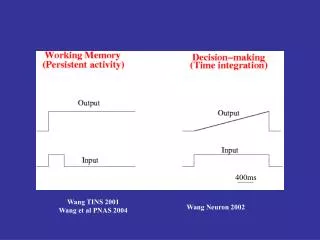
Data set used: I) To determine semantically similar documents: • Document keywords for corresponding year were selected: Criteria for selection: • 500 most cited documents were selected • 1995: documents cited 90 • 2001: documents cited 10 Content Coverage of PNAS in 1995 and 2001 Figure: Number of citations received in 1995 (left) and 2001 (right)
Data set used: II) For Co-word analysis: • Keywords list = Unique keyword [ Keywords + Publication title words – Stop words] Year #Unique Keywords 1995 4194 2001 5462 • Keywords with frequency 10 are eliminated • Final year wise keyword count for analysis: Year #Unique Keywords 1995 110 2001 113 Content Coverage of PNAS in 1995 and 2001
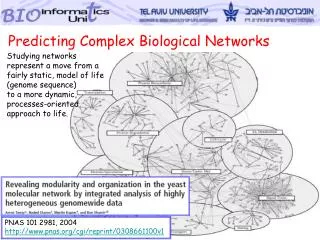
Data Visualization: Implemented in “Pajek” • Semantic Document Space: show “Research domains” Used Kamada Kawai algorithm to layout documents in a 2D space Content Coverage of PNAS in 1995 and 2001 1995 2001
Data Visualization: • Co-(Key)Word Space: show “Hot-topics” in the years Visualized using Fruchterman-Reingold 2D algorithm Content Coverage of PNAS in 1995 and 2001 1995 2001