Download
1 / 18
180 likes | 205 Views
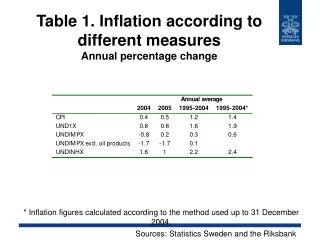
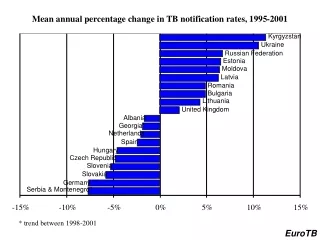
Analyzing the mean annual percentage change in TB notification rates from 1995 to 2001 in Eastern European countries using EuroTB data. Explore notification rates by age, sex, and origin, identifying trends and patterns.

E N D
Kyrgyzstan Ukraine Russian Federation Estonia Moldova Latvia Romania Bulgaria Lithuania United Kingdom Albania Georgia* Netherlands Spain Hungary Czech Republic Slovenia Slovakia Germany Serbia & Montenegro* -15% -10% -5% 0% 5% 10% 15% Mean annual percentage change in TB notification rates, 1995-2001 * trend between 1998-2001 EuroTB
Proportion of TB notifications with previous TB, 2001 EuroTB
Notification rate by sex, Georgia, 1996-2001 Rate / 100 000 300 Male Female Total 250 200 150 100 50 0 1995 1996 1997 1998 1999 2000 2001 EuroTB
Notification rates by age-groups, Estonia, 1995-2001 Rate / 100 000 120 >64 15-44 45-64 0-14 90 60 30 0 1995 1996 1997 1998 1999 2000 2001 EuroTB
Age-specific TB notification rates, 2001 (countries with tot notif >50/100 000) 250 200 ROM 150 GEO MDA 100 LTU LVA EST 50 0 0-4 5-14 15-24 25-34 35-44 45-54 55-64 65+ EuroTB
Age-specific TB notification rates, 2001 (countries with tot notif 13-50/100 000) 75 SVK 60 HUN BUL YUG 45 ALB SVN 30 CZH SPA 15 0 0-4 5-14 15-24 25-34 35-44 45-54 55-64 65+ EuroTB
Age-specific TB notification rates, 2001 (countries with total notif <13/100 000) 20 DEU 15 UNK 10 NET 5 0 0-4 5-14 15-24 25-34 35-44 45-54 55-64 65+ EuroTB
80 60 Male foreigner Rate / 100 000 40 Female foreigner Male national 20 Female national 0 0-4 5-14 15-24 25-34 35-44 45-54 55-64 > 64 Age group TB notification rates by age group, sex and geographic origin, 11 countries *, Western Europe, 2001 * Austria, Belgium, Denmark, Finland, France, Germany, Iceland, Netherlands, Norway, Sweden, Switzerland EuroTB
Mean age of TB cases, 1995-2001 65 55 West IRE 45 BEL UNK NOR 35 1995 1996 1997 1998 1999 2000 2001 65 Centre & Estonia SVK 55 CZH HUN SVN 45 EST ROM 35 1995 1996 1997 1998 1999 2000 2001 EuroTB
Mean age of TB cases, 1995-2001 West, by origin 70 NOR 60 BEL 50 IRE UNK 40 UNK BEL NOR 30 IRE 1995 1996 1997 1998 1999 2000 2001 Whole lines: nationals; stippled lines, foreigners. EuroTB
Relationship between total notification rate to rate of pulmonary notification, Europe*, 2001 Pulmonary cases / 100 000 140 ROM 120 100 GEO 80 TKM BIH 60 40 2 R = 0.9955 POR 20 0 0 20 40 60 80 100 120 140 Total notifications / 100 000 * excluding 13 countries with respiratory classification, missing data or 0 notifications EuroTB
Relationship between total notifications and extra-pulmonary notification rate, Europe*, 2001 2 R = 0.8801 Extra-pulmonary cases / 100 000 25 GEO TKM 20 ROM 15 POR 10 BIH 5 0 0 50 100 150 Total notifications / 100 000 * excluding 13 countries with respiratory classification, missing data or 0 notifications EuroTB
Percentage extrapulmonary cases, 1995-2001 (West) 50% 40% UNK NET 30% 20% DEU 10% SPA 0% 1995 1996 1997 1998 1999 2000 2001 EuroTB
50% 40% 30% 20% 10% 0% 1995 1996 1997 1998 1999 2000 2001 Percentage extrapulmonary cases, 1995-2001 (Centre) ALB CZH SVK SVN ROM BUL YUG HUN EuroTB
Percentage extrapulmonary cases, 1995-2001 (East) 30% GEO 20% LTU MDA LVA 10% EST KGZ RUS UKR 0% 1995 1996 1997 1998 1999 2000 2001 EuroTB
COUNTRY YEAR ORIGIN SEX AGEGR TBCASES ALB 1995 1 2 9 278 ALB 1995 1 1 9 386 ALB 1996 9 2 9 310 COUNTRY YEAR STATUS TYPESITE SITE CULTURE SMEAR TBCASES CZH 1998 2 2 1 1 1 455 CZH 1998 2 2 1 1 2 359 CZH 1998 2 2 1 1 9 24 CZH 1998 2 2 1 9 1 0 CZH 1998 2 2 1 9 2 370 EuroTB databases 1. Individual 2. Aggregate Other aggregate: drug resistance, outcomes, population.
EuroTB internet tool • http://www.eurotb.org:84/eng/connexion/default.asp
Individual TB dataCountry participation in collection of individual data, 1995-2001 Cases Countries 27 100000 Cases Countries 75000 18 50000 9 25000 0 0 * 1995 1996 1997 1998 1999 2000 2001 * Poland did not participate from 1996-1999; Bosnia-Herzegovina from 1996-2000 EuroTB