Download
1 / 1
10 likes | 127 Views
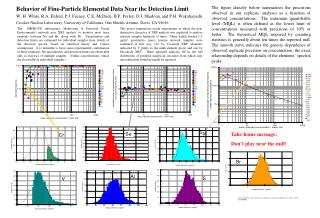
Behavior of Fine-Particle Elemental Data Near the Detection Limit W. H. White, R.A. Eldred, P.J. Feeney, C.E. McDade, B.P. Perley, D.J. Shadoan, and P.H. Wakabayashi Crocker Nuclear Laboratory, University of California, One Shields Avenue, Davis, CA 95616.

E N D
Behavior of Fine-Particle Elemental Data Near the Detection Limit W. H. White, R.A. Eldred, P.J. Feeney, C.E. McDade, B.P. Perley, D.J. Shadoan, and P.H. Wakabayashi Crocker Nuclear Laboratory, University of California, One Shields Avenue, Davis, CA 95616 The figure directly below summarizes the precisions observed in our replicate analyses as a function of observed concentrations. The minimum quantifiable level (MQL) is often defined as the lower limit of concentrations measured with precisions of 10% or better. The theoretical MQL imposed by counting statistics is generally about ten times the reported mdl. The smooth curve indicates the generic dependence of observed replicate precision on concentration; the exact relationship depends on details of the elements’ spectral peaks. The IMPROVE (Interagency Monitoring of Protected Visual Environments) network uses XRF analysis to monitor most trace elements between Na and Br, along with Pb. Uncertainties and detection limits are estimated for individual samples from details of the observed spectra, based on statistical theory and various assumptions. It is desirable to have some experimental confirmation of these estimates, but uncertainties and detection limits are observable only as statistics of multiple samples. (Unlike concentrations, which are observable in individual samples.) This poster summarizes recent experiments in which the non-destructive character of XRF analysis was exploited to analyze selected samples hundreds of times. Three lightly loaded (~1 mg/m3 gravimetric mass) routine network samples were examined in this way, two by Cu-anode XRF (elements indicated by Y prefix in the multi-element plots) and one by Mo-anode XRF. These repeated analyses fill in the full distribution of potential analytical outcomes from which only one realization would normally be reported. Pb Se Take-home message: Don’t play near the mdl! Cr Br Al S V Acknowledgement: This analysis was supported by the National Park Service under Contract C2350990001.