Download
1 / 24
240 likes | 307 Views
Thank you madam Chair. This presentation was prepared for submission to the Province regarding the inequity created by the Port Property Tax cap.

E N D
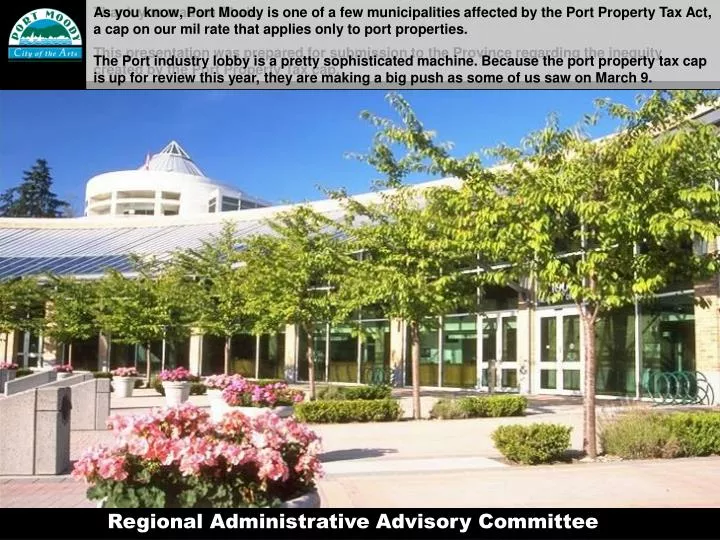
Thank you madam Chair. This presentation was prepared for submission to the Province regarding the inequity created by the Port Property Tax cap. As you know, Port Moody is one of a few municipalities affected by the Port Property Tax Act, a cap on our mil rate that applies only to port properties. The Port industry lobby is a pretty sophisticated machine. Because the port property tax cap is up for review this year, they are making a big push as some of us saw on March 9. Regional Administrative Advisory Committee
The aim of this presentation is for Port Moody to present its case. The Province is meeting with us on May 5th and we will be sharing this information with Finance Ministry officials. We wish to harmonize our input as part of the provincial consultation process with that of other port cities and of the GVRD’s Port Cities Task Force.
Downtown Vancouver We lost refinery plants and several industries in the 1980’s, so we truly appreciate the benefits of having industrial partners in our community. These losses impacted our revenues for over a decade. Last year, we finally retired our growth stabilization reserve, a special fund created in the 1980’s to offset the loss of industrial taxpayers. Port Moody is blessed with a fabulous ocean-front location. Our protected saltwater port is served by CPR’s main rail line and Barnet Highway.
Two of our major industries are on the waterfront. PCT is a thriving sulphur shipping terminal with growing tonnage and profits. PCT taxes are capped by the Provincial Port Property Tax Act Mill & Timber is a struggling sawmill, the last of its kind on BC saltwater and barely recovering from a decade-long softwood lumber dispute. PCT Tax: $27.50 per $1,000 Mill & Timber Tax: $51.20 per $1,000
Toward a newtaxation framework In a nutshell, our case is that the municipal tax framework, as it currently exists, cannot be used to implement provincial and national economic development goals such as improving port competitiveness. Port Moody is asking that the Province cease interfering with property taxes and remove the artificial cap. Port Moody is proposing that the Province initiate a review of the municipal tax framework.
Canadian Tax Freedom DayMonday June 19, 2006 Sources of information Statistics Canada has a Public Institutions Division; it specializes in tracking government revenues and spending. The second source is the Fraser Institute. Not known for being kind to governments, the Fraser Institute publishes the annual Tax Freedom Day. This is the day when we stop working for the government and… … start working for ourselves. That day is now in June of each year. Two main sources were used in this presentation. The first source is Statistics Canada.
Tax burden in constant $ It is clear from this Fraser Institute chart that Tax Freedom Day would be in early January if it were only for cities. It is also quite clear… Total that as the total tax burden grows, the cities’ relative share of the total burden gets smaller. Federal Provincial Municipal
Total tax burden Here is another view of the total tax burden that we enjoy as Canadians. Property taxes added up to 10% in 2004. That figure is 8% today. The remainder of the tax burden benefits senior governments. Property taxes
Property taxes Total tax burden Quite a few property owners are confused about that 8%. They think that it all comes to cities. Property taxes are used by several agencies. In fact, that leaves a very small portion of the total tax burden that ends up supporting municipal infrastructure and services. School District GVRD Translink City
Taxes are not always increasing This slide compares taxation in 1961 and 2004. It shows the percentage of total taxation for each category. It clearly shows that: Personal income tax climbed from 23% to 33% of the total tax burden during that time. Health & social insurance levies nearly tripled, from 7.2% to 17.3%. During the same period, property taxes came down from 15.5% to 10% of the total tax burden. This is Canada-wide in 2004. Today, that figure is 8%!
2006 Change / govt level Income tax Health & Social Property tax Source: Statistics Canada, Public Institutions Division, cats. 68-211, 68-204/207/213 This is the same information in graphic form With the trend toward a shrinking share for municipalities accelerating in 2006 and 2007.
Cities Relative to Gross Domestic Product property taxes stayed almost the same for over 40 years! Relative to Canada’s GDPProv / Fed taxes doubled (1961 – 2004) Prov / Fed Municipal taxes grew from 3.5 to 3.6% of GDP. Hardly noticeable. Port industry lobbyists claim that cities gouge industry. That’s just not the case. Cities offer more services each year. Cities absorb services downloaded by senior governments. Facts show that, far from gouging any taxpayer, municipal taxes are very reasonable. We all know the economy grew during that time. How did the different government levels do relative to the economy? Official figures released by senior governments show they did pretty well.
So we’ve seen how cities stack up when compared with senior governments as a percentage of the total tax burden and against the Gross Domestic Product (GDP). Another way to look at this is in straight $.
Federal Provincial Municipal 58 X 50 X 27 X $ collected / govt level There are a lot of government revenue sources, but Cities have access to only one main source of funds! We get a few grants, we get some lease revenues. But the bulk of cities’ revenues is from property taxes. Compared to 1961, the Federal government collected 58 times more money in 2004. The Province collected 50 times more. Cities collected 27 times more. Canadian cities’ appetite for taxpayers’ money has been half as much as that of senior governments. Yet urban centres is where population and economic growth has taken place. Now let’s look at the totals.
Tax appetite / govt level Federal Provincial Municipal Cities are running a very lean operation
Cities are not immune to this. When the city purchases goods, whether it is a pencil or a fire truck, we pay 7% PST. Yes. Cities use your taxes to pay tax! Because they live in the average Port Moody house, they get charged the average $65 increase to their 2007 taxes. That buys them more police officers and 6 more fire fighters along with more art and heritage programs. That leaves them with just over $1,000 in additional disposable income. So our average couple decides to spend the money left over after the government took its share. They splurge on a new TV. When they spend their $1074, the government collects another $140. The PST and GST on that purchase alone is twice the amount of Port Moody’s total tax increase for that year! Let’s look at an average BC family, a couple earning $75,000 in annual income. They get the average 2.7% wage increase for 2007. That’s an extra $2,000 on their paycheque. 33% is deducted at the source for federal and provincial taxes. You probably noticed that a portion of my pie chart is blank. How did it get to be this way? And what does it mean for the ordinary taxpayer? Here is what happens to people’s income over time. City taxes Other property taxes New $1,074 TV PST & GST on new TV What happensto a $2,000wage increase: Prov / Fed taxes You keep Income tax (33.5%)
Another shortcoming of provincial tax policy imposed on cities is its regressive nature. In 2005, North Vancouver’s Seniors’ Planning Society commissioned a survey of 600 north shore seniors. They asked them about housing costs. Here is what they found: 24 % of seniors who rent say that they struggle with their housing costs. Seniors who rent are twice as likely to have difficulty paying for housing than seniors who own their homes. We might wish to help, but cities are not allowed to charge taxes based on income. However, cities do manage one provincial system that is related to income and that’s the Home Owner Grant. Seniors who rent are not eligible for the provincial Home Owner Grant, even though they are the ones who are more likely to struggle to make rent. The higher taxes paid by the landlord (because they don’t get the Home Owner Grant) are passed on to the tenant. This also affects cities’ ability to deal with pressing affordable housing and homelessness issues. This is just one more reason why there is an urgent need to review the municipal tax framework. % of seniors whostruggle with their housing expenses 24 % 12 0 Do not Receive Provincial Home Owner Grant Receive Home Owner Grant Seniors: Owners Renters
Myths about City taxes Industry lobbyists claim that: Cities gain from economic activity. Well, we don’t. BC cities don’t tax the sale of goods. They don’t tax land transfers. They don’t tax labour. Lobbyists say that Cities take from industry to subsidize residents. Again, we don’t. The cost of equipping a city to deal with industrial fires, industrial spills, port security and maintaining trucking routes is very high. Parks, libraries and arts centres help them attract and retain employees. Industries don’t pay any more than their fair share. They say that Cities gain from increased property values. Anyone familiar with city taxation knows that we don’t. When the provincial Assessment Authority tells a city that property values have gone up, the mil rate goes down. They say that Budgets follow the same rules for all governments. Cities budget a fixed amount to be collected. Senior governments make a guesstimate of revenues based on economic forecasts (how many people will be employed, how many goods purchased), then reap the benefit if the economy grows more rapidly than projected.
Myths about City taxes Business groups, such as the Canadian Federation of Independent Business (CFIB), claim that the ratio of residential to commercial mil rate somehow shows how fair or unfair a given city’s taxes are. This is nothing but an urban myth! The cities with the highest ratio are cities where residential land values are highest: large urban communities like Coquitlam, Vancouver and Burnaby Cities where the ratio is the lowest have low residential land values: small northern communities like Stewart, Tahsis, Gold River The CFIB ratio is nothing more than an index of land values.
Our politicians tell us that they spend hours trying to explain how the mil rate works. I certainly do. When someone’s assessment has gone up 25%, that taxpayer fears that their city taxes will go up 25%. They don’t! A lobbyist waives a chart: “Port Moody’s ratio of residential to industrial has gone from 3 to 1 all the way to 15 to 1!” he says. Of course it has; old cottages have become million dollar homes. So here’s property tax 101, to help visualize how this actually works. As residential property values go up, the mil rate is adjusted down. You multiply the two and you get the amount of taxes for a specific property. Business lobby groups are right when they say that the mil rate has gone up faster for industries. The mil rate is just a multiplier that changes opposite to property values. Of course the ratio goes up when residential land values skyrocket in dense urban centres. Over time, the ratio becomes meaningless. The only true measure of fairness is how much cash is collected from each property class. Commercial and industrial values go up as well, but not as much as residential values. The mil rate goes down, but not as much as for residential areas. Again you multiply the two and you get the amount of taxes paid by that specific business. Residential to Commercial mil rate ratio The amount of taxes collected is the same. $ X mil = tax $ X mil = tax Residential Commercial
It is quite a challenge to explain the archaic mil rate and its fluctuations to citizens. Here is an attempt to simplify how this works, based on Bob’s Tire Shop. Bob’s tires sell for $1,000 per set. But Bob charges on the basis of the value of the vehicle. What is the mil rate? Bob’s first client is a Port Moody resident. “How much for your tires?” says the sports car owner. “Depends, how much is your car worth?” says Bob. “This baby is worth $100,000.” says the proud owner. Bob says: “This set of tires costs 1% of the value of your car.” “That’ll be $1,000.” says Bob. The next client is a Port Moody business owner. “How much for a set of tires?” says the owner of an old logging truck. “Depends, how much is your truck worth?” says Bob. “Old faithful may leak oil, but it’s still worth $10,000.” says the sawmill owner. Bob says: “This set of tires costs 10% of the value of your truck.” “What! You can’t charge me 10% when you only charge 1% to this other guy!” “That’ll be $1,000.” says Bob. The mil rate is like the percentage used by Bob. It is adjusted each year, to peg taxes to changing property values. Over time, the mil rate may differ widely between residential, industrial, commercial, etc. When tax increases are distributed equally to all classes, as in Bob’s shop, the mil rate makes no difference.
What drives property tax inequities Property tax of commercial & industrial land leaves economic policy to the whim of the real estate market Lobbying by port industries started when the BC Assessment Authority raised port property values in North Vancouver and on Vancouver’s waterfront. The value of industrial land went up disproportionately; waterfront land taxes went up after years of stagnation; port industries cried foul. What caused this? Some industries sold their waterfront land to developers. The ensuing development raised land values. Industrial neighbours who were left behind saw their property value go up. City taxes do not create pressure to put condos on industrial properties, the real estate market does. Cities do not control property assessments and the property tax framework, the province does. The Port Property Tax Act, capping the mil rate, is just tinkering at the edges. Everyone agrees that Ports are a very important part of the economy. However forcing a few port cities to burden their taxpayers to subsidize industries will not solve this problem in the long term. Ports competitiveness is good for BC and Canada. The costs of improving that competitiveness should be borne by all BC and Canadian taxpayers. What is needed is consultation with cities toward well thought-out changes to the tax framework.
How FCM defines the fiscal problem “The root of the problem lies in outdated fiscal arrangements that see 92 cents out of every tax dollar go to federal and provincial governments. The result is a chronic financial squeeze putting infrastructure repair on hold to provides services.” Gloria Kovach President, Federation of Canadian Municipalities
Questions? For further information, please contact Gaëtan Royer, City Manager City of Port Moody 100 Newport Drive Port Moody, BC V3H 3E1 604-469-4519