Download
1 / 23
230 likes | 235 Views
This study explores the frequency and development conditions of cold-air cyclogenesis along the East Coast of the United States using a multi-variable approach. Results provide insights and improve awareness for forecasters.

E N D
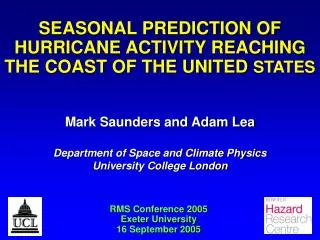
An Investigation of Cold-Air Cyclogenesis Along the East Coast of the United States Christopher Warren Graduate Student Plymouth State University NROW 9 November 7th, 2007
Types of East Coast Winter Storms • 4 classifications of East Coast cyclogenesis defined by Gurka et al. (1995). • Coastal events are; • Miller Type B • Zipper Lows • Cold-air Cyclogenesis
Cold-Air Cyclogenesis • Anderson et al. (1969) defines cold air cyclones as cyclonic disturbances that form over the ocean behind a polar front. • Evolves into a comma-shape pattern • Cold air comma cloud is downstream of an upper-tropospheric vorticity maximum. • Cold-air cyclogenesis is most frequent in the N. Atlantic, N. Pacific, and over the N. American continent (Weber and Wilderotter 1982) • Cold-air cyclogenesis relative to 1000-500 hPa thickness ribbon (Businger and Reed 1989, Gurka et al. 1995, Businger et al. 2003)
Previous Research of East Coast Cold-air Cyclogenesis • Case study by Rosenblum and Sanders (1974) • 18 December 1971 • Unusually cold air indicted by 1000-500 mb thickness. • Gurka et al. (1995) and Businger et al. (2003) discussed how a small synoptic-scale cyclone formed during a cold-air outbreak. • 24 February 1989 • Formed in cold air region relative to 1000-500 mb thickness. Visible satellite image at 1800 UTC 24 Feb. 1989. Figure taken from Rosenblum and Sanders (1974)
Objectives • Determine how frequently cold-air cyclones relative to the 1000-500 hPa thickness ribbon occur. • Examine conditions that are favorable for their development. • Find similarities or differences between these storms and other East Coast cyclones. • To do this a 9-yr climatology using a multi-variable approach will be used to hopefully improve forecaster awareness when the conditions are ripe for East Coast cold-air cyclogenesis.
Cyclone Identification • 9-year period from 1997-2006 • Cool Season Months (1 Oct – 30 Apr) • Data: North American Regional Reanalysis (NARR) • East Coast Winter Storm (ECWS) region for cyclone development and intensification modified from Hirsch et al. (2001) • Cyclone events were counted when any part of a central closed sea-level pressure isobar (interval of 2 hPa) was present in the ECWS region. ECWS Region
Determining Cold-Air Cyclogenesis Events • Cyclogenesis was determined to have occurred when the sea-level pressure in the center of circulation decreased by at least 2 hPa/6-hr period • At least 2 periods but not necessarily consecutive in 24 hrs • Events were classified as cold-air when daily 1000-500 hPa thickness values near the center of low pressure were below -0.5 standard deviations from a 32-yr daily mean. • Thickness data from NCEP/NCAR Reanalysis Dataset • Received from Anantha Aiyyer (NC. State)
ECWS Climatology Results • 512 total cyclones • Avg = 57 per season • 259 cyclogenesis; • Avg = 29 per season • 20 cold-air cyclones
Composite Comparison Methods • Generated composites using; • 20 cold-air cyclones • 43 non cold-air cyclones from the 2000-01 cool season. • Data: NARR • Composites generated for each of the three sub-regions using IDV.
North Sub-Region: 300 hPa Level 24-hrs prior to initial cyclogenesis (t = -24 hr) Cold-air Composite Non Cold-air Composite Isoheights (black solid lines), wind speeds (color-fill contours)
North Sub-Region: 300 hPa Level 12-hrs prior to initial cyclogenesis (t = -12 hr) Cold-air Composite Non Cold-air Composite Isoheights (black solid lines), wind speeds (color-fill contours)
North Sub-Region: 300 hPa Level Time of initial cyclogenesis (t = 0 hr) Cold-air Composite Non Cold-air Composite Isoheights (black solid lines), wind speeds (color-fill contours)
North Sub-Region: 500 hPa Level (t = -12 hr) Cold-air Composite Non Cold-air Composite Isoheights (black solid lines), temperature(color-fill contours)
North Sub-Region: 500 hPa Level (t = 0 hr) Cold-air Composite Non Cold-air Composite Isoheights (black solid lines), temperature(color-fill contours)
North Sub-Region: Surface (t = 0 hr) Cold-air Composite Non Cold-air Composite Isobars (black solid lines), 2 m temperature(color-fill contours), wind barbs (m/s) **Note: Due to time constraints composites from East and West sub-regions were left out.
Case Study • 21-22 February 1999 • Location: East Sub-Region • Reason: Cyclogenesis occurred when thickness was below -1.0 standard deviations. • Focused on atmospheric conditions 24-hr prior to 24-hrs following cyclogenesis event.
East Region: 700 hPa Level T = -12 hr T = 0 hr Isoheights (black solid lines), temperature(color-fill contours)
East Region: Surface T = -12 hr T = 0 hr Isobars (black solid lines), 2 m temperature(color-fill contours)
Conclusions • 20 cold-air cyclones identified off East Coast of U.S. during cool season months from 1997-2006. • On average expect to see about 2.2 cold-air cyclones per year. • Cold-air composites have colder temperatures and lower heights above 850 hPa with greatest differences seen in North Sub-Region composites from non cold-air composites. • Forecasting potential • Case studies show that the dynamical processes in cold-air cyclogenesis are similar to that of other extratropical East Coast midlatitude cyclones. • Future research should focus on mesoscale processes and air-sea interactions for East Coast cold-air cyclones.
Questions & Comments Special thanks to: Dr. Eric Hoffman (Advisor) Dr. Anantha Aiyyer Brendon Hoch