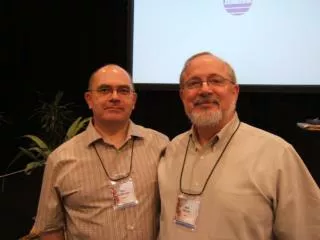
Phil Bartie and Simon Kingham
370 likes | 559 Views
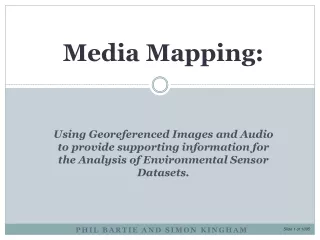
Media Mapping: Using Georeferenced Images and Audio to provide supporting information for the Analysis of Environmental Sensor Datasets. Phil Bartie and Simon Kingham. Slide 1 of 1095. Author Backgrounds.

Phil Bartie and Simon Kingham
E N D
Presentation Transcript
Media Mapping:Using Georeferenced Images and Audio to provide supporting information for the Analysis of Environmental Sensor Datasets. Phil Bartie and Simon Kingham Slide 1 of 1095
Author Backgrounds • Phil Bartie PhD Candidate Geospatial Research Centre (GRCNZ), University of Canterbury, NZ[LBS, Viewsheds, Speech UI] • Associate Professor Simon KinghamGeography Department, University of Canterbury, NZ[Sustainable Transport, Air Pollution, GeoHealth] www.OpenStreetMap.org
The BIG Picture • Origins of this Research • Problem encountered • Overview of Desired Solution • Fit of Existing Tools • Implementation of Solution -Mobile Application -Desktop Application • Usage Examples • Conclusions http://www.datenform.de/map14_1000.jpg
Origin of this Research • An air quality monitoring project being run in the New Zealand cities of Christchurch and Auckland funded by New Zealand Transport Agency • Monitor personal exposure to air pollution in daily commute • 1 month of field trials per city (2009) • Different modes of transport • Data Collected= Air quality, location, time, situational notes
Problem • The analysis of temporal datasets in GIS is often hampered by a lack of supporting relevant information on local conditions at the time of data capture. (e.g. A passing vehicle may be the cause of a noted spike in airborne particulate matter, but without the supporting situational information the spike may never be explicitly explained.)
Air Quality Samplers • GRIMM – PM1, PM2.5, PM10 [1 sample every 6 seconds] • Langan –CO, Temperature[1Hz] • 3007 – Particle counter[1Hz] Environmental datasets => Time stamped log files
GPS Cell Tower WiFi
Desired Solution Overview Two parts: 1) An automated method to allow researchers to capture co-located situational (context) data while on daily commute 2) A tool to assist researchers in using the capture datasets during the analysis phase
Restrictions/ Limitations [Overall] • Cheap solution– minimal budget (~80hrs programming) • Field ready within short timeframe • Easy to use [Mobile Data Capture Tool] • Robust • Small and lightweight • Battery life to capture data for at least 90 minutes
Ways to Capture Context • Written notes • Access to supporting data from sensor networks • Video • Audio Multimedia files provide an extra information channel when linked to GIS... (Cartwright et al. 2007)
Media Mapper (Red Hen Systems) • Links multimedia files to a map point • Geotagged files • Spatially enabled document retrieval system • One way relationship between location and files • Temporal content of media file is not spatially attributed www.openstreetmap.org
CamNav Mapper (BlueGen Ltd) • Standard video camera • Audio channel used to store GPS location information as binary data (like modem) • Video => see where on Map • Click on Map => see corresponding video
GeoMobSense (Kanjo et al. 2007) • Toolkit for smartphones to enable them to be used as data loggers • Ability to records sound levels using phone’s microphone, and add additional environmental sensors • Phone screen used to display current values • Fails to capture a spatially attributed audio & video feed for later analysis (eg only records sound level not audio, no image capture)
MESSAGE consortium • The MESSAGE consortium (Polak and Hoose 2008) have undertaken a number of projects using mobile phones as personal environmental sensors and data loggers. • Sensors included carbon monoxide, carbon dioxide, traffic volume, nitrogen levels • Data can be fed in real time to a data centre to reveal city wide trends • No facility to store audio/video with location for future retrieval
Tri- x Bi-Directional Search Tools • Jaejun (2002) - “A video geographic information system for supporting bi-directional search for video data and geographic information” • Zeiner (2005) – “Video documentation of urban areas.” No facilities to link to other temporal datasets(eg air pollution datasets)
Custom Solution Using FOSS • High level of integration between mapping, charting/graphing, video & audio • Co-located synchronized set of sensors sampling the local environment during data capture (i.e. mobile) • Small lightweight robust capture device • Good battery life performance
Nokia N82 Smartphone • Built in high sensitivity Assisted-GPS • Programmable in C, Java, Python, Flash • 2GB micro-SD card included • 5MP high quality camera • Good battery life • Able to run multiple custom applications simultaneously (if required)
Mobile Application Attempt 1 • Use Python – rapid development • Record video file 15fps (with audio track) • GPS data log file • Sync video and GPS using playhead position time (tightly coupled video and location every second) http://sourceforge.net/projects/pys60/ Video file tightly compressed using MP4 (70MB/hr) Depleted fully charged battery in 1hr
Mobile Application Attempt 2 • Custom Python S60 application to: • Sound recording all the time 8kHz • Photo every 3 seconds • GPS, Cell tower logged every 3 seconds with the play head position in the sound file • Sound – taking ‘spatial’ notes, listen for buses, cars etc • Approx 60MB /hr for sound file 320 by 240 – Front Camera
Easy to Use • 4 sensor kits + 4 phones • SIS install restricted to phone by IMEI • Right Soft Key to Launch DataLogger • www.symbiansigned.com
“Industrial Handbags” “Campbell Live” March 2009 http://www.3news.co.nz/Scientists-embark-on-air-pollution-study/tabid/817/articleID/93564/cat/84/Default.aspx
Python Code import e32, appuifw, graphics import key_codes import positioning import sensor import location import audio import sysinfo import camera import time counter =0 def handle_redraw(rect): canvas.clear() canvas.blit(img) def startrecording(): global S global counter t=int(time.time()) filename="e:\\datalogger\\snd_"+str(t)+".wav" S=audio.Sound.open(filename) S.record() img.point ((10,20),0xff0000,width=20) handle_redraw(()) def stoprecording(): global S S.stop() S.close() def fncSavedata (data): io=open("e:\\datalogger\\gps_travel.log",'a') io.write(data +'\n') io.close return def cb(event): global counter counter = counter + 1 t=int(time.time()) sat=event["satellites"] tm=sat["time"] tot=sat["satellites"] used=sat["used_satellites"] pos = event["position"] lat=pos["latitude"] lng=pos["longitude"] alt=pos["altitude"] vdop=pos["vertical_accuracy"] hdop=pos["horizontal_accuracy"] crse=event["course"] hdg=crse["heading"] hdgacc=crse["heading_accuracy"] spd=crse["speed"] sdb=sysinfo.signal_dbm() loc = location.gsm_location() sloc = str(loc) sloc = sloc.replace(',','/') global S sndtime=int(S.current_position() /1000) s = "gps:"+str(t)+","+str(sndtime)+','+str(tm)+","+str(tot)+"," +str(used)+","+str(lat)+","+str(lng)+ "," + str(alt) s = s +"," + str(vdop) + "," + str(hdop) + "," + str(hdg) + "," + str(hdgacc) + "," + str(spd) + "gsm:"+str(sloc)+","+str(sdb) fncSavedata(s) pic=camera.take_photo('RGB',(320,240),0,'none','auto','auto',1) sp="e:\\datalogger\\pic" + str(t) + '.jpg' pic.save(sp) img.clear() img.text((40,34),u'Log ID: ' + str(counter),0xff0000,font='normal') img.text((40,64),u'Sats: ' + str(used) + "/" + str(tot) ,0xff0000,font='normal') img.text((40,94),u'Spd: ' + str(int(spd)),0xff0000,font='normal') img.text((40,124),u'Snd: ' + str(sndtime),0xff0000,font='normal') handle_redraw(()) canvas = appuifw.Canvas(event_callback = None) appuifw.app.body = canvas appuifw.app.title = u"Data logger" w,h = canvas.size img=graphics.Image.new((w,h)) startrecording() positioning.set_requestors([{"type":"service","format":"application","data":"test_app"}]) positioning.select_module(270526860) positioning.position(course=1,satellites=1,callback=cb,interval=1000000,partial=1) app_lock = e32.Ao_lock() app_lock.wait() stoprecording() < 100 lines http://www.timemirror.com/opensource.htm
Data Capture Code Overview Record Audio S=audio.Sound.open(filename) S.record() On GPS Update Event Set description Write Log File Capture Photo AT=S.current_position() PT,AT, GPS Filename = PT.jpg PT=Phone Python time
Data Analysis Tool (Desktop) • Visualize data on map, linked by time • Sound file forms base time through which all other data streams are linked DirectSound Piccolo OGR PROJ ZedGraph (NZMG) C# .NET
Usage Examples Peaks – Bus pulling away – Image/Sound
Higher quality air in pedestrian precinct – Map Air quality drops when entering multi-storey car park
Spike in Carbon Monoxide corresponds to bus door opening– Sound
Conclusion • Was it useful? Yes • How was it useful? - easy to capture supporting information which proved useful in analysis phase to help explain data trends (worked as intended) - consistent, reliable - audio track useful for taking georeferenced notes - GPS + time log useful for exporting to other applications • Could it be improved? Yes • How? - video rather than stills - multi-thread application to continue capturing images when no GPS updates (eg inside buildings) - multiple cameras / wide angle lens - log sensor data to phone using Bluetooth link - more powerful query tools in desktop application
Acknowledgements Kreepa Shrestha, and Woodrow Pattinson who carried out the extensive field trials. Justin Harrison for setting up and supporting the environmental sensor equipment. This research would not have been possible without funding support from the Geospatial Research Centre (NZ) and New Zealand Transport Agency.
References • Blueglen Ltd (2009) CamNavMapper. Retrieved 20 May 2009 from http://www.blueglen.com/prod_camnav_single.htm • Cartwright W, Peterson MP, Gartner GF (2007) Multimedia cartography, Springer Verlag • JaejunYOO, Joo T, Park JH, Lee J (2002) A video geographic information system for supporting bi-directional search for video data and geographic information. Proceedings of International Symposium 2002 • Kanjo E, Benford S, Paxton M, Chamberlain A, Fraser DS, Woodgate D, Crellin D, Woolard A (2007) MobGeoSen: facilitating personal geosensor data collection and visualization using mobile phones Personal and Ubiqui-tous Computing • Polak J, Hoose N (2008) Mobile Environmental Sensing System Across Grid Environments • Red Hen Systems (2009) MediaMapper. Retrieved 20 May 2009 from http://www.afds.net/mediamapper.html • Zeiner H, Kienast G, Derler C, Haas W (2005) Video documentation of urban ar-eas. Computers, Environment and Urban Systems 29: 653-668