Download
1 / 55
640 likes | 1.27k Views
CHAPTAR-2 MEASUREMENT OF PRECIPITATION Ch. Karamat Ali (C.E) Department of Civil Engineering University of Lahore. PRECIPITATION AND ITS MEASUREMENTS. PRECIPITATION AND ITS MEASUREMENTS. Continued…. PRECIPITATION AND ITS MEASUREMENTS. PRECIPITATION AND ITS MEASUREMENTS.

E N D
CHAPTAR-2 MEASUREMENT OF PRECIPITATION Ch. Karamat Ali (C.E) Department of Civil Engineering University of Lahore
PRECIPITATION AND ITS MEASUREMENTS Continued…
PRECIPITATION AND ITS MEASUREMENTS Measurement of Rain Fall
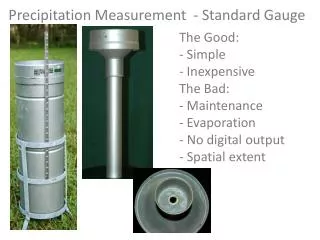
PRECIPITATION AND ITS MEASUREMENTS Non-Recording Rain-Gauges (Symon’s Rain-Gauge) • It consists of cylindrical vessel 127 mm (or 5”) in diameter with a base enlarged to 210 mm (or 8”) diameter. The top section is connected to a funnel provide with circular brass rim exactly 127 mm (5 inch) internal diameter. • The funnel shank is inserted in the neck of a receiving bottle which is 75 to 100 mm (3 to 4”) diameter. A receiving bottle of rain-gauge has a capacity of about 75 to 100 mm of rainfall and as during a heavy rainfall this quantity is frequently exceeded, the rain should be measured 3 or 4 times in a day on day of heavy rainfall lest the receiver fill should overflow. • A cylindrical graduated measuring device is furnished with each instrument, which reads to 0.2 mm. the rainfall should be estimated to the nearest 01. mm. • The rain collected in the bottle is measured through provided graduated cylinder.
PRECIPITATION AND ITS MEASUREMENTS Symon’s Rain-Gauge
PRECIPITATION AND ITS MEASUREMENTS Automatic Rain Gauges
PRECIPITATION AND ITS MEASUREMENTS Weighing Bucket Type Rain-Gauge (Figure)
PRECIPITATION AND ITS MEASUREMENTS Mass Curve
PRECIPITATION AND ITS MEASUREMENTS Automatic Rain Gauges
PRECIPITATION AND ITS MEASUREMENTS Tipping Bucket Type Rain-Gauge (Figure)
PRECIPITATION AND ITS MEASUREMENTS Automatic Rain Gauges
PRECIPITATION AND ITS MEASUREMENTS Float Type Automatic Rain-Gauge
PRECIPITATION AND ITS MEASUREMENTS Float Type Automatic Rain-Gauge (Graph)
PRECIPITATION AND ITS MEASUREMENTS Site Selection for Gauging Station
PRECIPITATION AND ITS MEASUREMENTS Sources of Errors in Recording the Measurements The most serious error is the “deficiency of measurements due to wind”. Vertical acceleration of air forced upwards over a gauge gives and upward acceleration to precipitation about to enter the gauge and “results in deficient catch”. Inclination of gauge may “cause lesser collection”. A 10% inclination gives about 15% low catch. Tipping of the buckets may be affected due to rusting or accumulation of dirt at the pivot. Mistakes in reading the scale of the gauge. Dents in the collector rim may change its receiving area. Funnel and inside surface require about 2.5 mm of rain to get moistened when the gauge is initially dry. This may amount to the extent of 25 mm per year in some areas.
PRECIPITATION AND ITS MEASUREMENT 23 Continued….
Example: Rainfall of five Rain Gauges is shown below. Calculate the Average Rainfall.
PRECIPITATION AND ITS MEASUREMENT 26 Continued….
PRECIPITATION AND ITS MEASUREMENT Thiessen Polygon Method (Figure-I) 27
PRECIPITATION AND ITS MEASUREMENT 28 Continued….
PRECIPITATION AND ITS MEASUREMENT 30 Continued….
PRECIPITATION AND ITS MEASUREMENT Thiessen Polygon Method Example: The map of a river basin is shown in the figure 1. Rainfall observation of the available rain gauge stations are noted on the map itself. Draw the Network of Thiessen Polygon and find out the Average Rainfall. Solution: The Thiessen Polygon are drawn as explained earlier and are shown in Figure-I. The area of each polygon has measured by planimeter and is shown in following table. The Map of the area is drawn into a scale of (1 cm=320 m) and the results are tabulated as below.
Average Precipitation:=∑AP ∑A = 76428.75 1110.75 =68.8 cm Ans
PRECIPITATION AND ITS MEASUREMENT 33 Continued….
PRECIPITATION AND ITS MEASUREMENT Isohyetal Method (Figure-II) 34
PRECIPITATION AND ITS MEASUREMENT 35 Continued….
Isohyetal Method PRECIPITATION AND ITS MEASUREMENT Example: Isohyets of different rainfall are shown in Figure-II. The rainfall and areas of adjacent Isohyets are also given in the figure. Find out the Average Rainfall of basin. Solution: i) Draw the Isohyets on the basis of Rainfall intensity catchment. ii) Find out the area through planimeter between the two Isohyets. iii) Find out the average of two Isohyets of particular area. iv) Then multiply the area with the mean Isohyets v) Find out the accumulative area and the product of each area and Isohyets. vi) Then the calculate the mean rainfall as under;
Pav = ∑Pm ∑A = 55790 854 = 65.33 cm Ans
PRECIPITATION AND ITS MEASUREMENT Example: • The normal annual rainfall at station A,B,C and D in a basin are 80.97, 67,59, 76.28 and 92.01 cm respectively. In the year 1975, the station D was inoperative and station A,B and C recorded annual precipitation of 91.11, 72,23 and 79.89 cm respectively. Estimate the rain fall at station D in that year. • Solution: • As the annual rainfall values vary more than 10 %, the Normal ratio method is adopted • PD = 92.01/3 X [91.11/80.79 + 72.23/67.59 + 79.89/76.28] • PD = 99.48 cm
PRECIPITATION AND ITS MEASUREMENT Example Solution • Since there is not much variation in the precipitation data, a simple arithmetic average of the precipitation observed at the 10 remaining stations was taken as under Precipitation at H = 21+23+19+20+23+24+19+21+22+18 = 210 = 21mm 10 10 In a catchment area, daily precipitation was observed by 11 rain gauge stations. On 2nd August 2005, the observations indicated that one gauge was out of order. The observation taken by 10 rain gauges are as follows Estimate the missing data at ‘H’
PRECIPITATION AND ITS MEASUREMENT Example The average annual precipitation at five rain gauge stations in a catchment is as follows. However the precipitation at station P was not available for the year 1996 because the rain gauge was out of order. The precipitation observed at the other stations in1996 was as follows. Evaluate the precipitation at station ‘P’ during 1996.
PRECIPITATION AND ITS MEASUREMENT Solution Precipitation at P (in mm) = ¼ (2400X2113 + 2400 X 2200 + 2400 X 2028 + 2400 X 2095) 2332 2431 2207 2231 = ¼ (2174+2172+2205+2253) = 2201 mm
PRECIPITATION AND ITS MEASUREMENT 47 Continued….
PRECIPITATION AND ITS MEASUREMENT • The correction to the data of rainfall at X from 1982 to 1971 is the slope of the dotted line divided by the slope of the second mass curve of 1983 to 1971, i.e. (c/b) / (s/b) = c/s Thus the corrected data at X is; Pcx = (Px) x c/s • All the inconsistent data of X from 1982 to 1979 are corrected by multiplying by c/s, the value of which is obtained from the plot measuring c and s as per scale 49
PRECIPITATION AND ITS MEASUREMENT Double Mass Curve (Figure-III) 50