Life Tables
E N D
Presentation Transcript
Life Tables By: Ahmad Zhafir Zulkifli Nadzirah Yusof
Outline • Introduction • Calculating survival rates using life table • Key components of life tables • Type of life tables • The Kaplan-Meier method • Survival analysis • Example of life tables • Application of life tables in epidemiology • Life Tables and Public Health • Limitations and Challenges in Using Life Tables • Case Study: Application of Life Table in Epidemiology • Conclusion • References Life Table for the Total Population: United States, 2007 (Abridged)
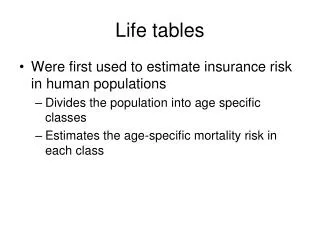
1. Introduction: what is life tables? • Life tables are a simple method of representing the mortality experience of a cohort of individuals. • It uses the actual observed survival of patients followed over time based on knowing the interval within which the event has occurred. • Life tables give estimates for survival during time intervals and present the cumulative survival probability at the end of the interval. • Therefore, it can be used to quantify prognosis. • It was the standard method for a long time by which survival is expressed and compared before the establishment of the Kaplan-Meier method. • The uses of life tables include making projections of life expectancy, showing the survival times of patients who have undergone a medical procedure and demonstrating the survival of patients who have been diagnosed with a chronic disease such as cancer.
1. Introduction: a bit of history • John GrauntF.R.S. (1620-74) - founding father of demography, epidemiology and vital statistics. • Graunt observed that mortality varied by age and created the first life table that showed a virtual population of one hundred people and tabulated how many would be alive at specific ages. • He was able to make estimates about the size of the population of London and England, birth rates and mortality rates of males and females, and the rise and spread of certain diseases.
2. Calculating survival rates using life table 2011 2012 2013 2014 2015 • n = 375 • If we want to describe the prognosis in these treated patients using all data available in the table, we cannot use 5-year survival - because the entire group has not been observed for 5 years! So how?
2. Calculating survival rates using life table • In this table, the data show the number of patients who started treatment each calendar year and the number of those who remained alive on each anniversary of the initiation of treatment. • Can we calculate 1 year survival after the beginning of treatment?
2. Calculating survival rates using life table • The probability of surviving for 5 years is the product of each of the probabilities of surviving each year: • = P1 x P2 x P3 x P4 x P5 • = 0.525 x 0.461 x 0.655 x 0.696 x 0.800 • = 0.088, or 8.8% • This way, we used all the data we have obtained, including the data for patients who were not observed for the full 5 years of the study. Efficient!
3. Key components of life tables • Intervals: interval since beginning treatment • Survivors (lx): number of subjects who were alive at the beginning of each interval • Deaths (dx): number of subjects who died during that interval • Withdrew (wx): number who “withdrew” during the interval (loss to follow up) or enrolled after study had started • Proportion died (qx): proportion who died during the interval • Proportion did not die (px): proportion who did not die during the interval
4. Type of life tables • Two major types of life tables: cohort (generation) life tables and period (current) life table. • A cohort life table shows the mortality experience of all persons born during a particular year such as 1957. It reflects the mortalityof an actual cohort from birth until no lives remain in the group. • A period life table gives an overview of the present mortality experience of a population and shows projections of future mortality experience. It enables us to project the future life expectancy of persons born during the year as well as the remaining life expectancy of persons who have attained a certain age. National life tables are usually period life tables. • Note that these are projections and not forecasts! • A complete life table contains data for every single year of age. An abridged life table typically contains data by 5- or 10-year age intervals. • From life tables we can construct life expectancy tables/graph.
5. The Kaplan-Meier method • In Kaplan-Meier life table, predetermined intervals such as 1 month or 1 year are not used • Instead, exact point in time where death (or event) occurs is identified. It terminates the previous interval, and a new interval is started • The number of persons who died at that point is used as the numerator, and the number alive up to that point including those who died at that time point is used as the denominator, subtracting any withdrawals that occurred before that point
5. The Kaplan-Meier method • Advantages: • Make the fullest use of exact time of death information • Examination of exact time of event is possible due to advancements in communication technology • Software are readily available that can easily calculate survival for large data sets using the Kaplan-Meier method
5. The Kaplan-Meier method • Important assumptions when using Kaplan-Meier life table: • No temporal change in the effectiveness of treatment or in survivorship over calendar time • The survival experience of people who are lost to follow-up is the same as the experience of those who are followed up • Specific assumption when using traditional life table: • That there is a uniform distribution of risk and withdrawal during each time interval and no rapid change in the risk or withdrawal within a time interval
8. Application of life tables in epidemiology • Estimating life expectancy and compare across regions • Evaluate the impact of diseases (e.g., HIV, cancer) on survival • Life tables used as tools for tracking survival rates in clinical studies and cohort studies • Used in designing public health interventions for high-risk populations (allocating time, money)
9. Usage of life tables (hands-on) https://www.ons.gov.uk/peoplepopulationandcommunity/birthsdeathsandmarriages/lifeexpectancies/datasets/lifetablesprincipalprojectionunitedkingdom
Understanding Health Disparities Gender Differences Life expectancy at birth for Malaysian males is 73 years, while females have a higher expectancy of 77.8 years.
Ethnic Variations Data indicates disparities among ethnic groups, with the Chinese population generally exhibiting higher life expectancy compared to Bumiputera and Indian populations. Abridged life table for Chinese, Malaysia 2020 Abridged life table for Indian, Malaysia 2020 Abridged life table for Bumiputera, Malaysia 2020
Ethnic Variations Data indicates disparities among ethnic groups, with the Chinese population generally exhibiting higher life expectancy compared to Bumiputera and Indian populations. Abridged life table for Chinese, Malaysia 2020 Abridged life table for Indian, Malaysia 2020 Abridged life table for Bumiputera, Malaysia 2020
Public Health Interventions Program Design 1 Focus on high-risk populations, such as older adults. Implementation 2 Roll out the intervention to target population. Impact Evaluation 3 Measure survival improvements and reduce age-specific mortality rates.
Chronic Disease Management Program 1 Malaysia's Ministry of Health launched a non-communicable disease (NCD) intervention program, targeting early detection and management of hypertension and diabetes. Impact 2 Life tables for middle-aged populations show an increase in survival rates due to early diagnosis and treatment. Specific Gains 3 Among hypertensive patients, controlled blood pressure reduced mortality by 25%.
Monitoring Health Programs Tracking Progress Life tables track changes in mortality rates across years and decades, providing a vital measure of public health intervention effectiveness. For example, Malaysia's national non-communicable disease (NCD) program demonstrates a 25% mortality reduction among hypertensive patients with controlled blood pressure, clearly visible in middle-aged life table data. Evaluating QALE Life tables assess not only longevity but also quality-of-life improvements. By incorporating metrics such as disability-adjusted life years (DALYs), we gain a comprehensive understanding of Quality-Adjusted Life Expectancy (QALE). Improved access to chronic disease management programs for hypertension and diabetes increases survival rates (evident in decreased age-specific mortality rates) and enhances QALE by mitigating these conditions' impact on daily life.
Pneumococcal Conjugate Vaccine (PCV) in Malaysia Program Impact The Malaysian government introduced the pneumococcal conjugate vaccine (PCV) into its national immunization program in December 2020. Life tables post-implementation show a significant decline in infant mortality rates due to reduced pneumococcal-related illnesses.
Chronic Disease Management Impact Life tables illustrate the effectiveness of Malaysia's chronic disease intervention program. 40-60 25% Age Range Hypertension The program focuses on middle-aged populations. Mortality reduction for hypertensive patients with controlled blood pressure. 15% 10 Diabetes Years Mortality reduction for diabetic patients enrolled in early management programs. Life tables track changes in mortality rates over time.
Limitations and Challenges Data Quality Incomplete or biased data affects accuracy. Assumptions Static mortality rates may not reflect real-time changes. Age Grouping Abridged tables can obscure trends in specific age groups.
Case Study: COVID-19 Impact Objective Findings Life tables were used to study shifts in mortality rates during the COVID-19 pandemic. The pandemic significantly impacted older adults (65+). Mortality rates increased in this age group due to COVID-19 complications. These shifts provided insights into the pandemic's impact on overall life expectancy. However, vaccination programs helped reduce excess deaths.
Case Study: Malaysian Assured Lives (2011–2015) Objective Analyze mortality trends among insured individuals in Malaysia. Develop more accurate life tables tailored to the insured population. Key Findings Higher mortality rates in older age groups. Younger insured individuals had lower mortality than the general population. Males exhibited higher mortality rates than females. Implications for Life Tables Findings refined mortality assumptions in life tables for the Malaysian insured population. Life tables now better represent age and gender-specific risks for actuaries and insurers. Relevance to Public Health The study underscores the role of targeted life tables in evaluating mortality trends. Data from such analyses can complement broader population-based life tables to address disparities and improve resource allocation. Source: Life Insurance Association of Malaysia (LIAM) - Mortality Investigation Summary Report (2011–2015).
Conclusion Key Takeaways Future Directions 1 2 Life tables are critical tools in public health. Incorporate comorbidities and socioeconomic factors.
Questions and Discussion How can we improve data accuracy in life tables? What new public health challenges can life tables address?
References • Celentano, D. D., & Szklo, M. (2019). Gordis Epidemiology (6th ed., pp. 128–138). Elsevier. • Friis, R. H., & Sellers, T. A. (2014). Epidemiology for Public Health Practice (5th ed.). Jones & Bartlett Learning. • Connor, H. (2022). John Graunt F.R.S. (1620-74): The founding father of human demography, epidemiology and vital statistics. Journal of Medical Biography, 32(1), 096777202210798. https://doi.org/10.1177/09677720221079826 • Optimum Pension. (2020, September 14). Celebrating the Father of The Life Table. Optimum Pensions. https://www.optimumpensions.com.au/celebrating-the-father-of-the-life-table/ • Department of Statistics Malaysia. (2024). Abridged Life Tables, Malaysia 2022 - 2024 (pp. 177–233). Department of Statistics Malaysia. https://www.dosm.gov.my/portal-main/release-content/abridged-life-tables-malaysia-2024 • Arias, E., Xu, J., & Kochanek, K. (2023). National Vital Statistics Reports - United States Life Tables, 2021. US Centers for Disease Control and Prevention. https://www.cdc.gov/nchs/products/index.htm • Morgan, E. (2019, December 2). Guide to interpreting past and projected period and cohort life tables. Office for National Statistics. https://www.ons.gov.uk/peoplepopulationandcommunity/healthandsocialcare/healthandlifeexpectancies/methodologies/guidetointerpretingpastandprojectedperiodandcohortlifetables • Life Insurance Association of Malaysia (LIAM). (2015). Mortality investigation summary report (2011–2015). Retrieved from https://www.liam.org.my/pdf/LIAM_Mortality_Investigation_Summary_Report_2011_2015.pdf • Ministry of Health Malaysia. (n.d.). COVIDNOW portal: COVID-19 deaths and mortality rates. Retrieved from https://covidnow.moh.gov.my/ • Ministry of Health Malaysia. (2020). Manual pelaksanaan program imunisasipneumokokaluntukkanak-kanakdalam program imunisasikebangsaan. Retrieved from https://hq.moh.gov.my/bpkk/images/3.Penerbitan/2.Orang_Awam/8.Kesihatan_Kanak_Kanak/2.PDF/3_manual_pelaksanaan_program_imunisasi_pneumokokal.pdf • World Health Organization. (2024, May 24). COVID-19 eliminated a decade of progress in global life expectancy. Retrieved from https://www.who.int/news/item/24-05-2024-covid-19-eliminated-a-decade-of-progress-in-global-level-of-life-expectancy • Health Data Exchange (HDX). (n.d.). Global impact of COVID-19 on life expectancy: The Lancet findings. Retrieved from https://www.healthdata.org/news-events/newsroom/news-releases/covid-19-had-greater-impact-life-expectancy-previously-known • The Lancet. (n.d.). Impact of COVID-19 on global mortality rates and life expectancy. Retrieved from https://www.thelancet.com