Download
1 / 27
270 likes | 405 Views
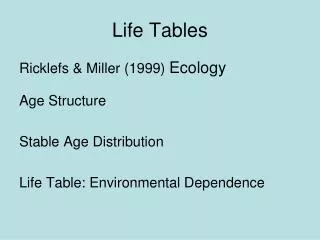
Using Probability Ideas in Life Tables. (Session 11). Learning Objectives. At the end of this session, you will be able to explain how conditional probabilities are used in life table survival calculations Understand the sources and meaning of these probabilities and numbers surviving.

E N D
Using Probability Ideas in Life Tables (Session 11)
Learning Objectives At the end of this session, you will be able to • explain how conditional probabilities are used in life table survival calculations • Understand the sources and meaning of these probabilities and numbers surviving
An Example • Below is part of an abridged Life Table (LT) for South African males, published by WHO • See more in handout and at web reference given • Beginning with 1999, WHO produces LTs annually for all Member States. These have several uses and form basis of all WHO's estimates about mortality patterns and levels world-wide.
Explanation The LT example slide shows data which must be based on real-life observation - the column headed nqx - which shows mortality rates, i.e. probabilities of dying, in each range of ages. These feed into a range of LT computations that combine the age-specific conditional probabilities of dying into overall life experience. This session introduces the basic calculation; uses are seen later!
Users Many bodies are interested in using life-tables and LT-based methods. For example, the World Bank publishes “basic data” about numerous countries. Typically, these are:- • Population Growth Rate (%); 2. Life Expectancy at Birth; 3. GNP per Capita; 4. Access to Safe Water (%). e.g.http://www.worldbank.org/depweb/ english/modules/basicdata/datasubsbasic.htmlfor Sub-Saharan Africa
Statisticians/demographers’ role Life expectancy at birth derives from the LT. Many non-statisticians quote/try to interpret no’s from LTs, but collection, compilation, & processing of LT data is up to skilled professionals. Can be sophisticated, but here and in later sessions, we consider basic probability aspects, and some uses of the LT.
Imagined basis of computations Imagine a conventional starting population – a cohort – of 100,000 newborn babies all born effectively simultaneously. To portray the calculations reasonably accurately it is convenient to imagine this quite large cohort population. It allows us to turn probabilities [0 ≤ p ≤ 1] into integer form as “numbers surviving” and “numbers dying” ~ generally easier to visualise, especially for non-specialists.
Numbers living to age x ~ lx : 1 In standard demographic terminology, the no. living at exact age x, i.e. no. that survive up to their xth birthday, is denoted by lx. This no. is associated with an exact point in time. [Note that in some typefaces, the lower-case letter “el” looks like an upper-case letter “i” or numeral 1, but in the LT context, lower-case el is the only one of those that is used with subscripts as above.] Below we show step-by-step how lx values are calculated from the input data, the nqx values.
Numbers living to age x ~ lx : 2 • If the cohort initially comprises 100,000 newborns, l0 = 100,000 and this is the first entry in the lx column of the LT in Figure 1. It corresponds to the number living at the start of the age-range from 0 to 1.
Proportion dying in age range ~ nqx Figure next to it in the column headed nqx is 0.05465. This is probability of dying in age range represented by the row, i.e. probability of dying between birth and the first birthday – a period of length 1 year (n) starting at exact age 0 (x)
Death & survivor numbers: 1 • How many deaths should we expect before the cohort’s first birthday? In other words, how many of the 100,000 babies would on average die aged 0? • This is a binomial distribution mean and is 100000 x 0.05465 = 5465 individuals (see Session 06 of module H1)
Death & survivor numbers: 2 Therefore we expect 100000 – 5465 = 94535 individuals to reach their first birthday. This figure is l1 and we find it in the second row of the LT in the lx column.
nqx revisited Alongside it we see nqx is 0.01906, and age range represented in this row is “1 – 4”, i.e. this number is probability that a boy dies between exact age 1 and end of his 4th year of life, i.e. before his 5th birthday.
nqx is a conditional probability So here nqx means 4q1 = 0.01906. Roughly 1.9% of children will die across those four years i.e. something of the order of 1 in 200 per year of age for each of the 4 years. Note that this probability of dying is a conditionalprobability. This is a probability of dying between ages 1 and 5, conditional on not having died between ages 0 and 1.
Interpretation This means the probability applies to the 94535 survivors to age 1. Between 1st & 5th birthdays expected no.of deaths is 94535 x 0.01906 = 1801 and the expected no. of survivors to 5th birthday = 94535 - 1801 = 92734. Thus l5 = 92734 appears as 3rd entry in lx column.
Continuation Same procedure is carried out for subsequent entries in the lx column. Arithmetically, we pick up the data for each successive death rate and apply it to the population that survived to the start of that period. When we carry this through to age 100, there are only 25 expected survivors, to the nearest whole number. For practical purposes of further computations, we will assume these old gentlemen all die before the age of 105.
Caution At this stage we are assuming that the data input to the LT has come from some unspecified source. Do not lose sight of the fact that this is a major task! Either data are derived (and smoothed) from a country’s census or vital registration operations or they come from agreements to use a mixture of local or neighbour data, common patterns, projections from previous figures, assumptions and so on.
Example interpretation Reading this from right to left, you start with the initial cohort of l0, then multiply by the probability of surviving to age 1 i.e. 1p0 = (1 - 1q0), then by the conditional probability of surviving from age 1 to age 4 given having already survived to age 1i.e.4p1) then by the next conditional probability of surviving– 10p5 etc
Learning interpretation It is valuable to learn how to read and write the language of “demographic algebra” ~ not just because it is briefer and quicker than verbal description, but also because each term has a precise meaning and avoids possible confusion. More to follow in later sessions!
“Abridged” Life Table Notice that the LT in Figure 1 puts various age-groups into different-sized bundles of ages e.g. 1 year, then 4 years, then 5’s thereafter. This shortens table compared to one with 100+ rows one for each year of age,but still separates major phases of life [see for example page 1 of a complete LT at http://en.wikipedia.org/wiki/Life_table ] N.B. 1-year prob. of dying as infant aged 0 to 1 is higher than for any other 1-year period till about age 70 – see exercises.
Reading about demography You may find a variety of books available in Government Department or University libraries. In terms of filing the subject may be linked to “actuarial science”, “epidemiology”, “health” or “population”. There are many very large and professional websites. A small selection of those well worth visiting if you can get access to them are Stats Online of Statistics South Africa, National Statistics UK, or the Population Reference Bureau in US.
Some reference books Hinde, A. (1998) Demographic Methods. Hodder Arnold, London, U.K. Kpedekpo, G.M.K. (1982) Essentials of Demographic Analysis for Africa. Heinemann, London. U.K. Murdock, S.H., Kelley, C., Jordan, J, Pecotte, B. and Luedke, A. (200x) Demographics: A Guide to Methods and Data Sources for Media, Business and Government. Paradigm Publishers, Boulder, Colorado, U.S.A. Pollard, A.H., Yusuf, F. and Pollard, G.N. (1995) Demographic Techniques, 4th edn. A.C. Wilson, Sydney [previous editions by Pergamon Press Australia] Poston, D.L. and Micklin, M. (editors) (2006) Handbook of Population (Handbooks of Sociology and Social Research). Springer, New York, U.S.A. Rowland, D.T. (2003) Demographic Methods and Concepts. Oxford University Press, U.S.A. Siegel, J.S. and Swanson, D.A. (2004) The Methods and Materials of Demography, 2nd edn. Academic Press. Tarver, J.D. (1996) The Demography of Africa. Praeger Publishers, Westport, Connecticut, U.S.A. Zuberi, T., Sibanda, I. and Udjo, E.O. (2005) Demography of South Africa. M.E.Sharpe Inc., U.S.A.
Practical work follows to ensure learning objectives are achieved…