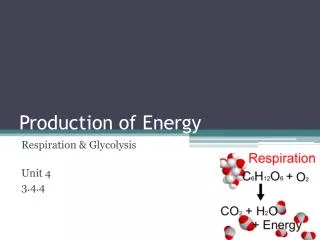
Metabolic Pathways: Energy Production Through Glycolysis, TCA Cycle, and Electron Transport Chain
This article explores the intricate metabolic pathways responsible for energy production in cells, including glycolysis, glycogenolysis, and the citric acid (TCA) cycle. We discuss how glucose is converted into ATP through various biochemical processes, focusing on key molecules like Acetyl-CoA, NADH, and FADH2. The role of the electron transport chain in synthesizing ATP from reduced cofactors is highlighted, along with the importance of fatty acid oxidation and ketone body production in energy metabolism. Discover the connection between these pathways and their significance in maintaining cellular energy balance.

Metabolic Pathways: Energy Production Through Glycolysis, TCA Cycle, and Electron Transport Chain
E N D
Presentation Transcript
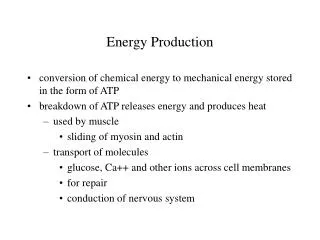
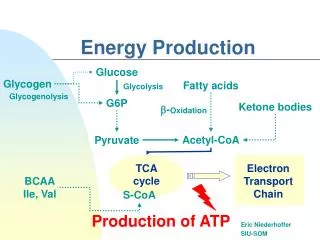
Glycogen Fatty acids Glycolysis Glycogenolysis G6P Ketone bodies b-Oxidation Pyruvate Acetyl-CoA TCA cycle Electron Transport Chain BCAA Ile, Val S-CoA Production of ATP Energy Production Eric Niederhoffer SIU-SOM Glucose
CS OAA Cit NADH MDH NAD+ AC Mal ICit NADH to ETC NAD+ FR ICDH FADH2 to ETC Fum NADH a-KG FADH2 SDH NAD+ aKGDH Suc FAD+ NADH SCoAS SCoA GTP GDP Tricarboxylic acid cycle Acetyl CoA
Mal OAA 3H+ Suc Fum ATP H+ MDH 2H+ 2H+ 2H+ O2 H2O NAD + NADH 2H+ FAD FADH2 C II C I C III C IV SDH NADHDH Cyt bc1 ATPase Cyt c ox 2e- QH2 cyt cox cyt cred ATP H+ 2H+ 2H+ 3H+ 2H+ 2H+ 2H+ Electron Transport Chain matrix inner membrane intermembrane space 10H+ims/4H+m = 2.5H+ per ATP