Download
1 / 51
530 likes | 654 Views
Introducing Human Geography. Starting Points. Science, Social Science, Geography. What do we mean when we say something is a science ? What do we mean when we say something is a social science ? Just what is Geography ?. Science.

E N D
Introducing Human Geography Starting Points
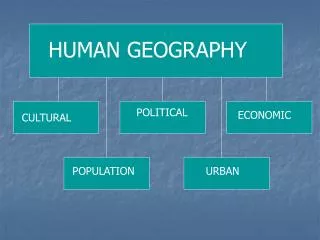
Science, Social Science, Geography • What do we mean when we say something is a science? • What do we mean when we say something is a social science? • Just what is Geography?
Science • Sci"ence (?), n. [F., fr. L. scientia, fr. sciens, p.pr. of scire “to know.” Cf. Conscience, Conscious.] • Science means knowledge — but knowledge comes from many valid sources — • Experience • Experiment • Faith • Authority • For 400 years, the word science has meant knowledge acquired using a process we call the scientific method.
The Scientific Method • What characteristics should knowledge acquired by the Scientific Method have? • Science should be: • Rational — based on reasoning, logic. • Objective — free from bias, prejudice. • Systematic — thorough, methodical, organized. • Predictive — testable (“repeatable”). • But science should not be: • Dogmatic — science should be open to new ideas. • Ideological — science should not be based on beliefs or opinions. • Trivial — science should not be a pointless accumulation of facts.
Steps to Science 1 2 3 4 5 6
The Crucial Step: Testing • If you don’t make • testable predictions • it’s not • science!
NOT SCIENCE Male alligators can’t breed if temperatures get too high \ Climate change killed the dinosaurs. Flowering plants dominate just as dinosaurs disappear \ Chemicals found in flowering plants killed the dinosaurs SCIENCE The rare element iridium is found at the boundary between the era when dinosaurs dominate and when they disappear. \ Whatever increased iridium levels killed off the dinosaurs. An Example: Science & Not-Science What Killed The Dinosaurs? Based on SJ Gould’s “Sex, Drugs, Disasters, and the Extinction of Dinosaurs.” In The Flamingo’s Smile (1985)
Is Science Always Right? • NO! • Science is done by people — • and people are only human! • Sometimes people make mistakes • Sometimes people are reluctant to change • Sometimes people lie • Sometimes people don’t want a “scientific” answer!
Science & Social Science • Science is a way of getting knowledge using the scientific method. • A social science is a field of study that uses the scientific method to look at the social and cultural environment.
Geography • Is Geography a social science? • Yes!AndNo!And Sometimes! • Geography is a unique discipline • Geography connects other disciplines • Geography emphasizes space • BUT — Geography isn’t always easy to define!
Development of Geography The Çatalhöyük map (6,200 BCE) For more information see: http://www.atamanhotel.com/catalhoyuk/oldest-map.html A “T-and-O” map (1472 CE)
What is Geography? • “Geography is the study of of where things are located on Earth’s surface and the reasons for the location.” (Rubenstein 2008, xv) • “…the scientific study of the location of people and activities across Earth, and the reasons for their distribution.” (Rubenstein 2008, 2) What do Geographers think about? • Place – location. • Regions – unique and distinctive areas. • Scale – similarities at local, regional and global levels. • Space – mapping regular patterns. • Connections – relationships among places.
PLACE: Location • What features make places unique and distinctive? Where are placeslocated? • Important Concepts in location: • Place Names (“toponyms”) • Site (physical [“fixed”] location) • Situation (relative location) • Mathematical location (coordinates)
PLACE: Location – Site & Situation Site: San Francisco Situation: San Francisco 1769 Outpost of Spain; in New Spain/Mexico; in Alta California Primary political relationships: Monterey; Mexico City; Madrid Primary trading relationships: New Spain, Philippines Today In California, USA Primary political relationships: Sacramento; Washington DC Primary trading relationships: Pacific Rim, Global • 1769 • In the Western Hemisphere • In the Midlatitudes • On the West Coast of North America • Mediterranean climate (but foggy!) • Peninsula and superb harbor • Today • In the Western Hemisphere • In the Midlatitudes • On the West Coast of North America • Mediterranean climate (foggy!) • Peninsula and superb harbor
REGIONS: Types of Regions • What are the distinctive characteristics that define a place, and that make one place more (or less) like others? • Important Concepts • Types of Regions: • Formal (defined using uniform, homo-genous, or dominant characteristics) • Functional (defined using communication or transportation systems or functions) • Vernacular (defined by people’s cultural identity or beliefs) • Regional Integration
Regions: Formal, Functional, Vernacular US TV Markets
REGIONS: Cultural Ecology • Human-Environment Interaction • The environment can limit human activity. • BUT– does the environment makepeople behave and develop in certain ways? • Environmental determinism: culture is mostly determinedby the physical environment. • Possibilism: the environment imposes some limits, but people can adapt and adjust their culture to their environment.
REGIONS: Modifying the Environment Sources: http://www.planetware.com/map/netherlands-land-reclamation-on-the-north-sea-coast-map-nl-nl2.htm; http://stateimpact.npr.org/oklahoma/2012/08/17/drought-keeps-oklahoma-pilot-grounded/
SCALE: Local to Global • Some things workdifferently, and have different effects at different scales. • Globalization of Economy: • At the global scale, we are increasingly interconnected and interdependent. • At the local scale, this has lead to increasing specialization – places focus on their unique assets (if they have any). • Globalization of Culture: • At the global scale, we are becoming more culturally uniform – fast food, hotels, cars, cell phones, are pretty much the same over much of the world. • At the local scale, some groups are fighting to retain their local culture – sometimes violently.
SPACE: Distribution • How are things arranged? • Where are they located? • Important Concepts: • DENSITY • CONCENTRATION • PATTERN
DISTRIBUTION:Densityand Concentration • Density: “How many per?” • Concentration: “How spread out?” • Major League Baseball • Density • 1952: 16 teams • 2012: 30 teams • Concentration • 1952: All Eastern US • 2012: Most regions of the US and in Canada 1952 2012
DISTRIBUTION: Patterns West Nile Virus, 2012 Oils seeps & tarballsalong the California coast Created using Google Earth; data source: http://walrus.wr.usgs.gov/seeps/where.html; http://diseasemaps.usgs.gov/wnv_us_human.html
CONNECTIONS • How are places and regions connected? How do they interact? • Important Concepts: • SPATIAL INTERACTION • Networks, transportation systems, distance decay • Cultural diversity • Space-time compression • DIFFUSION • Relocation Diffusion • Expansion Diffusion • Hierarchical (through a social or physical hierarchy) • Contagious (from person to person) • Stimulus (spread of an underlying idea)
CONNECTIONS: Spatial Interaction US Airways route map AMTRAK route map Sources: http://www.aviationexplorer.com/us_airways_airlines.htm; http://www.amtrak.com/ccurl/948/674/System0211_101web,0.pdf
Relocation diffusion Physical movement, across space – people migrate, taking their culture with them. Expansion diffusion Ideas spread through a population. Hierarchical – spreading through a hierarchy of people or places. Contagious – spreading through contact, like a disease, from person to person. Stimulus – spread of an underlying idea, even when the actual idea doesn’t diffuse. CONNECTIONS: Diffusion
Maps & Mapmaking • All maps are made for a specific purpose. • Although they’re not always labeled, all maps have four characteristics: • Scale — the relationship between distance on the map and distance on the ground. • Projection — a way of showing the round earth on a flat map. • Symbols — arbitrary shapes, colors or patterns that make distributions or arrangements clear. • Grid system — a system of coordinates; a way of determining a place’s location.
Map Scale • Scale can be expressed in three ways: • Verbal – “One inch equals one mile.” • Fraction – “1:63,360” • Graphic – • Each has advantages and disadvantages.
San Diego at Four Scales 1:25,000 1:50,000 1:100,000 1:250,000
large & SMALL “Large Scale” 1:25,000 1:50,000 “Small Scale” 1:100,000 1:250,000 Remember — these are fractions!
The Problem of Projection • The Problem: You can’t go from round to flat without something being distorted! • Every flat map is distorted in some way —but we can choose the kind of distortion. • Shape • Area • Distance • Direction
Projections: Examples Azimuthal Cylindrical Note how the apparent sizes and shapes of Greenland and Australia change. Maps of the US tend to be made using conic or polyconic projections Conic
Symbols • A variety of symbols are used on maps. • There are basically four kinds of symbols: • Pictures: • Dots: • Colors & Patterns: • Lines: ——— --------- ==========
Pictures — either representative images or arbitrary shapes — can be an effective way of showing where things are located on a map. Note how important the legend is. Without one, the symbols would be meaningless. Symbols: Pictures Mineral Production Sites in the Salt Lake Region Produced online, using the National Atlas of the USA Source: http://nationalatlas.gov/
Dots — plain, colored, or varying in size or shape — are another effective way of showing distributions. Symbols: Dots Source: http://earthquake.usgs.gov/earthquakes/recenteqscanv/
This is a shaded relief map — a map in which elevation is indicated using colors. Like all map symbols, color is useful — but if you don’t know what the colors actually mean, a map like this can be very misleading. Symbols: Color & Shading What do you think the color green means? Hint: it’s not vegetation! This map was produced using ICEMAPS2 online: http://icemaps.des.ucdavis.edu/icemaps2/ICEMapInit.html
Isolines are lines that connect points on a map with equal values. The name of the isoline varies depending on what you’re mapping: TEMPERATURE – isotherms AIR PRESSURE – isobars ELEVATION – contour lines Symbols: Isolines Twelve Month Average Temperatures, January-December 2010 ºF Adapted from: http://www.cpc.ncep.noaa.gov/products/analysis_monitoring/regional_monitoring/us_12-month_avgt.html
There are many ways to show data on a map. Sometimes colors and shading patterns are effective. At other times, using various kinds of line symbols may be a better choice. Consider these maps of San Diego bay. Which is easiest to understand at a glance? Which is probably best if you need to know an exact elevation? Symbols: Colors vs. Lines Shaded relief Contour lines These maps were produced using Global Mapper (www.globalmapper.com) and digital elevation models from http://www.gisdatadepot.com/
Grid Systems • Cartesian coordinates (named for French philosopher and mathematician René Descartes (1596-1650)) are an example of a grid or coordin-ate system. • Using the horizontal (“x”) axis and vertical (“y”) axis, we can specify the position of any object. 3, 90 1, 21 4, 21 2, 28
Grid Systems: Latitude & Longitude • Using parallels of latitudewe determine the angular distance (in degrees) north or south of the equator, from 0º to 90º North or South • Using meridians of longitudewe determine the angular distance (in degrees) east or west of the prime meridian, from 0º to 180º East or West
There are a number of other grid systems in use that you may encounter: UTM Divides the world between 84º North and 80º S into numbered rectangles 6º wide and 8º tall. Township & Range Used in most of the US for land surveys Divides land into 36 mi2 “townships” Other Grids Sources: http://gis.pima.gov/survey/; http://pubs.usgs.gov/pp/1395/report.pdf; http://egsc.usgs.gov/isb/pubs/factsheets/fs07701.html;
All maps are made for a specific purpose — to show things the map maker thinks are interesting or worthwhile. “All-purpose” or “general use” maps are also made for a specific purpose — to be useful to the widest possible number of users. To do this, general purpose maps have to include a lot of information. To do that they use a lot of different symbols — colors, lines, pictures, etc. The “All-Purpose” Map http://interactive2.usgs.gov/learningweb/images/mapsshow4_topo.jpg
Is thisa map? • No! • This is a NASA Space Shuttle photograph (taken October 3, 1994). • This is an example of remote sensing. Data acquired from orbit can be used to study changes in land use, population growth, or other phenomena. • But a photograph is not a map — the image is not projected, the scale may vary from top to bottom or side to side, there is no legend, etc. Source: http://earth.jsc.nasa.gov/scripts/sseop/photo.pl?mission=STS068&roll=202&frame=17
The Global Positioning System in use today lets people accurately find their location just about anywhere on the face of the earth. GPS is everywhere – in cars, in scientific experiments, in cell phones. GPS
Geographic Information Systems • A Geographic Information System (GIS) is a computer-based system for acquiring, analyzing, processing, and displaying spatial data — that is, information such as location (where a particular point is located) and various characteristics (for example, elevation, vegetation, population, hydrology, slope, etc.). • Using a GIS, we can analyze and display an enormous amount of information — we can produce new and better maps.
Using a GIS • A GIS can be used for a wide range of applications — urban planning, emergency response systems, resource management, etc. • Using a GIS it is possible to • Produce maps using whatever scales, projections, symbols or color schemes best display the information. • Store, retrieve and analyze the data associated with various locations • Model and analyze site characteristics.
The following variables were used to produce this analysis: land-cover classification site harvest history infestation by spruce bark beetles proximity to existing roads proximity to power lines percent slope slope aspect (orientation) proximity to anadromous streams concentration of bear and moose designated wetland areas land use land ownership GIS Example: Timber Harvest for Kachemac Bay Source: http://www.csc.noaa.gov/lcr/kachemak/html/gishtml/forharmo.htm
The availability of simple GIS and GPS data has made it possible for just about anybody to create complex interactive maps. Google Earth is a free applications that lets people create maps that couldn’t even have been considered just a few years ago! Mash-Ups
Haiti 2010 on Google Earth KML file source: mw1.google.com/mw-earth-vectordb/haiti/Haiti-Earthquake-nl.kml
Mathematical Models • A model is a representation of reality. • Mathematical models try to represent reality using equations and algorithms to simulate and predict what will happen in the real world. • Models can be combined with GIS to produce maps of what is happening, what may be happening, and what might happen.