Download
1 / 1
10 likes | 172 Views
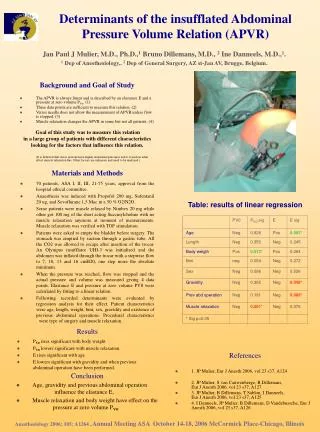
The abdominal pressure - inflated volume relation in pigs. Mulier J.P. 1 , Missant C. 2 , Crombach M. 2 , Vandermeersch E 2 1. Dep of Anesthesia, Sint JAN Brugge-Oostende, Bruges, Belgium , 2. Dep of Anaesthesiology, University hospitals, KULeuven, Leuven, Belgium

E N D
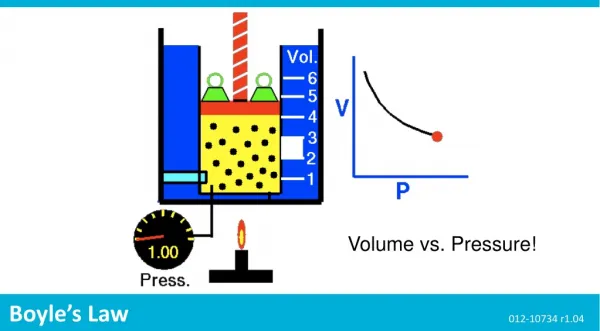
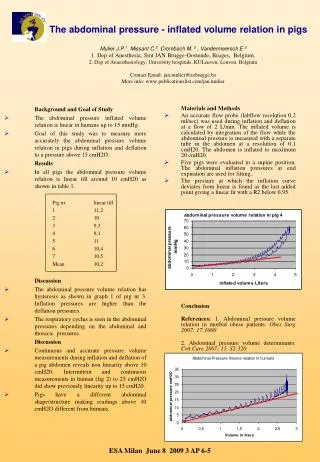
The abdominal pressure - inflated volume relation in pigs Mulier J.P.1, Missant C.2, Crombach M. 2 , Vandermeersch E 2 1. Dep of Anesthesia, Sint JAN Brugge-Oostende, Bruges, Belgium, 2. Dep of Anaesthesiology, University hospitals, KULeuven, Leuven, Belgium Contact Email: jan.mulier@azbrugge.be More info: www.publicationslist.com/jan.mulier Background and Goal of Study • The abdominal pressure inflated volume relation is linear in humans up to 15 mmHg. • Goal of this study was to measure more accurately the abdominal pressure volume relation in pigs during inflation and deflation to a pressure above 15 cmH2O. Results • In all pigs the abdominal pressure volume relation is linear till around 10 cmH20 as shown in table 1. Pig nr linear till 1 11,2 2 10 3 9,3 4 9,1 5 11 6 10,4 7 10,5 Mean 10,2 Discussion • The abdominal pressure volume relation has hysteresis as shown in graph 1 of pig nr 3. Inflation pressures are higher than the deflation pressures. • The respiratory cyclus is seen in the abdominal pressures depending on the abdominal and thoracic pressures. Discussion • Continuous and accurate pressure volume measurements during inflation and deflation of a pig abdomen reveals non linearity above 10 cmH20. Intermittent and continuous measurements in human (fig 2) to 25 cmH2O did show previously linearity up to 15 cmH20. • Pigs have a different abdominal shape/structure making readings above 10 cmH2O different from humans. Materials and Methods • An accurate flow probe (labflow resolution 0,2 ml/sec) was used during inflation and deflation at a flow of 2 L/min. The inflated volume is calculated by integration of the flow while the abdominal pressure is measured with a separate tube in the abdomen at a resolution of 0,1 cmH20. The abdomen is inflated to maximum 20 cmH20. • Five pigs were evaluated in a supine position. The abdominal inflation pressures at end expiration are used for fitting.. • The pressure at which the inflation curve deviates from linear is found as the last added point giving a linear fit with a R2 below 0,95. Conclusion References: 1. Abdominal pressure volume relation in morbid obese patients. Obes Surg 2007; 17:1000 2. Abdominal pressure volume determinants. Crit Care 2007; 11, S2:320 ESA Milan June 8 2009 3 AP 6-5