Download

1 / 13
130 likes | 154 Views
Achieving Analytics Driven Decisions by Providing Leadership & the Organizational Tools and Processes that Generate Insights. What Del Monte Was Trying to Solve:. Gap analysis to understand drivers and opportunities Drive corporate end-end visibility of trade across the holistic organization:

E N D
Achieving Analytics Driven Decisions by Providing Leadership & the Organizational Tools and Processes that Generate Insights.
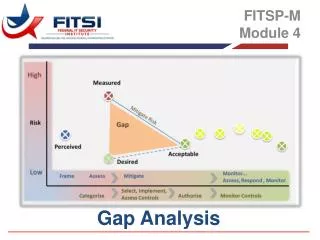
What Del Monte Was Trying to Solve: • Gap analysis to understand drivers and opportunities • Drive corporate end-end visibility of trade across the holistic organization: • Sales Execution • Demand Planning • Finance • Generate customer level P&L’s • Understand trade spend for better planning • Calculate accurate Broker Commissions
Trade Planning Business Challenges • Need holistic approach to solve Integrated Business Planning challenges • Business does not have visibility to measure the effectiveness of their Promotion spend • SVP Process is manual in excel workbooks causing delays in completing the planning for fiscal year on time. • Integrated Planning for business is adversely impacted by not having all the key indicators to generate the plan in SVP (Shipment History, Consumption Data (Nielsen, Syndicated Panel) Lack of integration for Base and Incremental volume reporting in TPM No material level daily promotion planning capabilities Lack of Harmonization of Internal and External Data Hierarchical Data Challenges with Manual Excel SVP No Visibility to handle out of stock and on shelf availability Limited Reporting and Analytics due to lack of integrated Data sources
Trade Spend – Gaps and Themes Visibility to Trade Spend Joined Data: Across Systems & Data Sources Dashboards with Drilldown Capabilities & Alerts Financial Visibility Customer Product P&L Volume, Trade Spend, Resolved and Unresolved $ Deductions Visibility Visibility to Plan vs. Actuals & Drivers Year, Quarter, Month, YTD, YAGO, AOP & 6+6 Forecast Management Trade ROI Accurate Master Data Product Group New Item Broker Commissions – Organizational Territory Structure 4
TPM Simplified View • Trade ROI Analysis • Deductions Settlements • Trade Spend Reports IT Process External Data Lake Red Shift (AWS) External POS Data Shipment Customer Nielsen Iri Promotions APO Product SAP BW Datawarehouse Layer (HANA) • Shipment • Customer Product • IBP • Sales Base Volume Applications SAP ECC Transactions (Orders/Billing/Master Data) Pricing Conditions Rebate Agreements SAP TPM Incremental Planning Demand Planning Application
Gaps in End to End Trade Visibility • Planning process is fragmented • Base in one system • Incremental is another system • Quota and AOP not harmonized • Poor integration of Shipments(Actuals) due to master data issues • Overall Trade Spend visibility missing • Accruals and Claims adjustments outside of the system • Customer and Product P&L not reconciled with spend types • Delay in Broker commission payouts • Trade Spend vs Quota (AOP) a challenge
Roadmap to Cover the Gaps • Base Volume • Accrual in Actuals • Settlements Deduction Management for Promotions • Nielsen/IRI Data Harmonization for Trade ROI • Flexible and robust reporting • Trade Spend (Volume, GRAT, Profit) • Promotions Recap • Dashboards and Advanced Analytics
Roadmap to Cover the Gaps End to end visibility, Optimization ROI ROI Accruals FP&A P&L CO-PA Hi Radius Capability Deductions AR/AP Billbacks Settlements VSP Scorecard Data platform Promotion Base Volume POS TPM Event management Security (Territory Mgmt, Product and Customer Hierarchy, List Price ) Time
Data Flow between Disjointed Systems Flat file Excel/867 data Nielsen Data --Consumer data --Mapping for Cust & Prod Flat file Quota/Rates High Radius Data: --TPM Promos --F16 deductions --F16 checks Paxata AWS - Red Shift Data: --APO Base (monthly) --Nielsen (monthly) --TPM incremental --TPM Promo detail (daily) --Flat file quota/rates --BW Cubes (BPCS, Spins, Hierarchy, Actual shipped volume) --Claims BW Data --BPCS --Spins --Hierarchy --Actual Volume --Incremental (daily) --Promotion detail (daily) SVP Base planning --Nielsen (monthly) --BW Cubes (BPCS, Spins, Hierarchy, Actual shipped volume) APO Data --Incremental TPM Data (daily) --Incremental --Promotion detail O9 Reporting Reports: --Trade Forecast --Promo Recap --Trade Spend Mgmt A/R Data --F16 Deductions & checks Flat file ECC/Flat File – Military
Flow of Accruals/Settlements • Process Flow for Settlement of Promotion • TPM • Accrual Calculation at customer/account hierarchy-product/product type combination • Accrual Posting TPM 1.1 TPM Accruals (ZB) DR Promo Exp P&L – T-XX CR Promo Accr. B/S - T-XX 1. TPM Accruals DR Promo Accr. B/S - T-XX CR Promo Exp P&L – T-XX ECC HighRadius 2. Settlement (DG) DR Promo Accr.B/S – T-XX CR Customer • ECC • Accrual posted to appropriate balance sheet and expense account • CO-PA line-items having visibility to CRM Trade Promotion and Spend type with appropriate posting amounts 3. Final Settlement/Over Spend Processing (ZD/ZO) DR Promo Exp P&L – T-XX CR Promo Acc B/S - T-XX
Trade ROI Actionable Insights Promotion Analysis by Product Summary View Test Data Test Data Test Data ROI Analysis 30
Realized Benefits • The GAPS in TPM is because of disparate Planning and Actual Systems • Accurate Accruals and Settlements is Key to P&L and Planning for Trade Spend • Realizing the Trade Spend at Customer and Product level for different tactic type is key • Customer and Product P&L require a Trade View • Trade ROI requires lot of data harmonization to succeed