Your river assignment
Your river assignment. In groups of 4-6 produce a report that has: Title Hypothesis Content of report (what are you going to do?) History of the area and geographical features and processes. Data collection methods (survey techniques) Data analysis (graph creation)

Your river assignment
E N D
Presentation Transcript
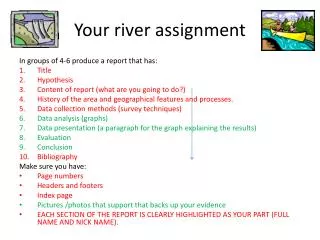
Your river assignment In groups of 4-6 produce a report that has: • Title • Hypothesis • Content of report (what are you going to do?) • History of the area and geographical features and processes. • Data collection methods (survey techniques) • Data analysis (graph creation) • Data presentation (Graphs and a paragraph for the graph explaining the results no OPINIONS) • Evaluation • Conclusion • Bibliography Make sure you have: • Page numbers • Headers and footers • Index page • Pictures /photos and annotate that support that backs up your evidence • EACH SECTION OF THE REPORT IS CLEARLY HIGHLIGHTED AS YOUR PART (FULL NAME AND NICK NAME).
Hand in date: • The start of the day on Thursday 1stof March and submitted via email (7.30am) with your full name (on your section of the report) on to the relevant teacher on a word document.
The 3 choices of research • Infiltration rates at the river bank. • Is there evidence of past flooding in the area? • Velocity river profile x two sites. but include the two you don’t choose as influences to your title
(A) The Vegetation Site Vegetation diversity, coverage & height inVegetated area Measure vegetation diversity by throwing the quadrant to your feet randomly, and counting the Number of different plant specie in the quadrat – in a sparse area to represent where there are human encroachments and a dense area to represent where there have not been human encroachments Vegetation coverage/density will be recoded by eyeballing and estimating the % coverage on a sparsely and a densely vegetated area. To measure the height of vegetation measure the highest piece of vegetation from the center square of the quadrat and record its height in cm using a small ruler • Diversity • Trial 1….. • Trail 2….. • Trial 3….. • Trial 4….. • Trial 5….. • Average no of species…….. • Coverage • Trial 1….. • Trail 2….. • Trial 3….. • Trial 4….. • Trial 5….. • Average % cover…….. • Height • Trial 1….. • Trail 2….. • Trial 3….. • Trial 4….. • Trial 5….. • Average Height (cm)……..
(A) The Vegetation Site Vegetation diversity, coverage & height inSparse area Measure vegetation diversity by throwing the quadrant to your feet randomly, and counting the Number of different plant specie in the quadrat – in a sparse area to represent where there are human encroachments and a dense area to represent where there have not been human encroachments Vegetation coverage/density will be recoded by eyeballing and estimating the % coverage on a sparsely and a densely vegetated area. To measure the height of vegetation measure the highest piece of vegetation from the center square of the quadrat and record its height in cm using a small ruler • Diversity • Trial 1….. • Trail 2….. • Trial 3….. • Trial 4….. • Trial 5….. • Average no of species…….. • Coverage • Trial 1….. • Trail 2….. • Trial 3….. • Trial 4….. • Trial 5….. • Average % cover…….. • Height • Trial 1….. • Trail 2….. • Trial 3….. • Trial 4….. • Trial 5….. • Average Height (cm)……..
(A) The Vegetation Site Infiltration rates: Vegetated area Put 5 centimeters of water in the infiltrometer and time how long it takes to infiltrate into the soil on a dense and sparsely vegetated area. The dense area represents an area without human encroachments & the sparse area represents and are where they have been human encroachments. Level of water Time taken In Inflitrometer to infiltrate 5 cm 4 cm ……….. 3 cm ………… 2 cm ………… 1 cm ………….. 0 cm ………….. Total time taken: ________ (minutes) To find out the average infiltration rate of your soil divide the total time taken, by 5 this will give you the average rate in cm per second Average infiltration rate in vegetated area: ________ (cm/min)
(A) The Vegetation Site Infiltration rates: Sparse area Put 5 centimeters of water in the infiltrometer and time how long it takes to infiltrate into the soil on a dense and sparsely vegetated area. The dense area represents an area without human encroachments & the sparse area represents and are where they have been human encroachments. Level of water Time taken In Inflitrometer to infiltrate (mins) 5 cm 4 cm ……….. 3 cm ………… 2 cm ………… 1 cm ………….. 0 cm ………….. Total time taken: ________ (minutes) To find out the average infiltration rate of your soil divide the total time taken by 5, this will give you the average rate in cm per minute Average infiltration rate in sparse area: ________ (cm/min)
(B) The Biodiversity Site Biodiversity & the environmental health of the area • Diversity (number of different species) • Trial 1….. • Trail 2….. • Trial 3….. • Trial 4….. • Trial 5….. • Average no of species per trial…….. • Total no of species…….. Use the litmus paper to get this data: • Vegetation pH …………….. 2) Soil pH ………………. 3) Water pH …………….. • Abundance (of living organisms) • Trial 1 • Trail 2 • Trial 3 • Trial 4 • Trial 5 • Average no of living organisms per trial …… • Total no of living organisms….. Abundance & diversity is measured by holding the net in the river for 30 seconds and lightly disturbing the bed of the river in front Names & numbers of organisms
(C) The River Processes Site Measuring the wetted perimeter, cross sectional area & hydraulic radius Width……………… • Put in the other verticals (50 cm away from each other – the first two are marked), and record the depth midway between each one • Number of verticals …….. • Average depth………. • Cross sectional area (average depth x width) ………cm • Hydraulic radius =………………… Depth of vertical B)……… Depth of vertical A)………
(C) The River Processes Site Wetted perimeter & velocity • Wetted perimeter of stream _______ meters • Velocity of the stream = • Trail 1 = ____seconds • Trail 2 =____seconds • Trial 3 = ____seconds • Trial 4 = ____seconds • Trial 5 = ____seconds • Average _____ seconds to travel 5 meters • The stream velocity in meters a second ______ velocity= distance time
(D) The Flooding Assessment Site The Hjulstrom Curve……. Assessing the potential of the river to flood 1) Long Axis of largest sediment: ………………. Velocity needed to move largest sediment:……………. (based on Hjulstrom curve) 2) Width of River in flood……………… Average Height of river in flood…………… Cross sectional Area of river in flood………….. (av. Width x Height) Estimated Wetted Perimeter in flood…………… (depth x 2 + width) 3) Estimated Discharge of river in flood………….. (Cross sectional Area x Velocity) Estimated Hydraulic Radius of the river in flood………. * Remember to take 5 photos of evidence of flooding