Download
1 / 52
520 likes | 657 Views
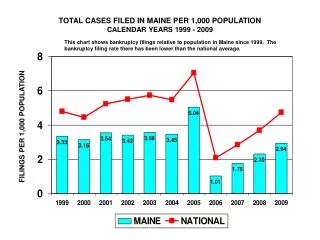
TOTAL CASES FILED IN MAINE PER 1,000 POPULATION CALENDAR YEARS 1999 - 2009. This chart shows bankruptcy filings relative to population in Maine since 1999. The bankruptcy filing rate there has been lower than the national average. FILINGS PER 1,000 POPULATION.

E N D
TOTAL CASES FILED IN MAINE PER 1,000 POPULATIONCALENDAR YEARS 1999 - 2009 This chart shows bankruptcy filings relative to population in Maine since 1999. The bankruptcy filing rate there has been lower than the national average. FILINGS PER 1,000 POPULATION
TOTAL CASES FILED IN MASSACHUSETTS PER 1,000 POPULATIONCALENDAR YEARS 1999 - 2009 This chart shows bankruptcy filings relative to population in Massachusetts since 1999. The bankruptcy filing rate there has been lower than the national average. FILINGS PER 1,000 POPULATION
TOTAL CASES FILED IN NEW HAMPSHIRE PER 1,000 POPULATIONCALENDAR YEARS 1999 - 2009 This chart shows bankruptcy filings relative to population in New Hampshire since 1999. The bankruptcy filing rate there has been lower than the national average. FILINGS PER 1,000 POPULATION
TOTAL CASES FILED IN RHODE ISLAND PER 1,000 POPULATIONCALENDAR YEARS 1999 - 2009 This chart shows bankruptcy filings relative to population in Rhode Island since 1999. The bankruptcy filing rate there has been close to the national average for the last three years. FILINGS PER 1,000 POPULATION
TOTAL CASES FILED IN PUERTO RICO PER 1,000 POPULATIONCALENDAR YEARS 1999 - 2009 This chart shows bankruptcy filings relative to population in Puerto Rico since 1999. The bankruptcy filing rate there has been below the national average. FILINGS PER 1,000 POPULATION
TOTAL CASES FILED IN CONNECTICUT PER 1,000 POPULATIONCALENDAR YEARS 1999 - 2009 This chart shows bankruptcy filings relative to population in Connecticut since 1999. The bankruptcy filing rate there has been lower than the national average. FILINGS PER 1,000 POPULATION
TOTAL CASES FILED IN NEW YORK PER 1,000 POPULATIONCALENDAR YEARS 1999 - 2009 This chart shows bankruptcy filings relative to population in New York since 1999. The bankruptcy filing rate there has been lower than the national average. FILINGS PER 1,000 POPULATION
TOTAL CASES FILED IN VERMONT PER 1,000 POPULATIONCALENDAR YEARS 1999 - 2009 This chart shows bankruptcy filings relative to population in Vermont since 1998. The bankruptcy filing rate there has been well below the national average. FILINGS PER 1,000 POPULATION
TOTAL CASES FILED IN DELAWARE PER 1,000 POPULATIONCALENDAR YEARS 1999 - 2009 This chart shows bankruptcy filings relative to population in Delaware since 1999. The bankruptcy filing rate there has been above the national average for the last two years. FILINGS PER 1,000 POPULATION
TOTAL CASES FILED IN NEW JERSEY PER 1,000 POPULATIONCALENDAR YEARS 1999 - 2009 This chart shows bankruptcy filings relative to population in New Jersey since 1999. The bankruptcy filing rate there has been a little lower than the national average since 2001. FILINGS PER 1,000 POPULATION
TOTAL CASES FILED IN PENNSYLVANIA PER 1,000 POPULATIONCALENDAR YEARS 1999 - 2009 This chart shows bankruptcy filings relative to population in Pennsylvania since 1999. The bankruptcy filing rate there has been a little lower than the national average. FILINGS PER 1,000 POPULATION
TOTAL CASES FILED IN MARYLAND PER 1,000 POPULATIONCALENDAR YEARS 1999 - 2009 This chart shows bankruptcy filings relative to population in Maryland since 1999. The bankruptcy filing rate there has been a little below the the national average for the last six years. FILINGS PER 1,000 POPULATION
TOTAL CASES FILED IN NORTH CAROLINA PER 1,000 POPULATIONCALENDAR YEARS 1999 - 2009 This chart shows bankruptcy filings relative to population in North Carolina since 1999. The bankruptcy filing rate there has been lower than the national average. FILINGS PER 1,000 POPULATION
TOTAL CASES FILED IN SOUTH CAROLINA PER 1,000 POPULATIONCALENDAR YEARS 1999 - 2009 This chart shows bankruptcy filings relative to population in South Carolina since 1999. The bankruptcy filing rate there has been well below the national average. FILINGS PER 1,000 POPULATION
TOTAL CASES FILED IN VIRGINIA PER 1,000 POPULATIONCALENDAR YEARS 1999 - 2009 This chart shows bankruptcy filings relative to population in Virginia since 1999. The bankruptcy filing rate there has generally been close to the national average. FILINGS PER 1,000 POPULATION
TOTAL CASES FILED IN WEST VIRGINIA PER 1,000 POPULATIONCALENDAR YEARS 1999 - 2009 This chart shows bankruptcy filings relative to population in West Virginia since 1999. The bankruptcy filing rate there has been below the national average for the last four years. FILINGS PER 1,000 POPULATION
TOTAL CASES FILED IN LOUISIANA PER 1,000 POPULATIONCALENDAR YEARS 1999 - 2009 This chart shows bankruptcy filings relative to population in Louisiana since 1999. The bankruptcy filing rate there has generally been close to the national average. FILINGS PER 1,000 POPULATION
TOTAL CASES FILED IN MISSISSIPPI PER 1,000 POPULATIONCALENDAR YEARS 1999 - 2009 This chart shows bankruptcy filings relative to population in Mississippi since 1999. The bankruptcy filing rate there has been above the national average. FILINGS PER 1,000 POPULATION
TOTAL CASES FILED IN TEXAS PER 1,000 POPULATIONCALENDAR YEARS 1999 - 2009 This chart shows bankruptcy filings relative to population in Texas since 1999. The bankruptcy filing rate there has been well below the national average. FILINGS PER 1,000 POPULATION
TOTAL CASES FILED IN KENTUCKY PER 1,000 POPULATIONCALENDAR YEARS 1999 - 2009 This chart shows bankruptcy filings relative to population in Kentucky since 1999. The bankruptcy filing rate there has been a little above the national average. FILINGS PER 1,000 POPULATION
TOTAL CASES FILED IN MICHIGAN PER 1,000 POPULATIONCALENDAR YEARS 1999 - 2009 This chart shows bankruptcy filings relative to population in Michigan since 1999. The bankruptcy filing rate there has been above the national average since 2003. FILINGS PER 1,000 POPULATION
TOTAL CASES FILED IN OHIO PER 1,000 POPULATIONCALENDAR YEARS 1999 - 2009 This chart shows bankruptcy filings relative to population in Ohio since 1999. The bankruptcy filing rate there has been above the national average since 2000. FILINGS PER 1,000 POPULATION
TOTAL CASES FILED IN TENNESSEE PER 1,000 POPULATIONCALENDAR YEARS 1999 - 2009 This chart shows bankruptcy filings relative to population in Tennessee since 1999. The bankruptcy filing rate there has been well above the national average. FILINGS PER 1,000 POPULATION
TOTAL CASES FILED IN ILLINOIS PER 1,000 POPULATIONCALENDAR YEARS 1999 - 2009 This chart shows bankruptcy filings relative to population in Illinois since 1999. The bankruptcy filing rate there has been a little higher than the national average. FILINGS PER 1,000 POPULATION
TOTAL CASES FILED IN INDIANA PER 1,000 POPULATIONCALENDAR YEARS 1999 - 2009 This chart shows bankruptcy filings relative to population in Indiana since 1999. The bankruptcy filing rate there has been well above the national average. FILINGS PER 1,000 POPULATION
TOTAL CASES FILED IN WISCONSIN PER 1,000 POPULATIONCALENDAR YEARS 1999 - 2009 This chart shows bankruptcy filings relative to population in Wisconsin since 1999. The bankruptcy filing rate there has been near the national average for the last five years. FILINGS PER 1,000 POPULATION
TOTAL CASES FILED IN ARKANSAS PER 1,000 POPULATIONCALENDAR YEARS 1999 - 2009 This chart shows bankruptcy filings relative to population in Arkansas since 1999. The bankruptcy filing rate there has been higher than the national average. FILINGS PER 1,000 POPULATION
TOTAL CASES FILED IN IOWA PER 1,000 POPULATIONCALENDAR YEARS 1999 - 2009 This chart shows bankruptcy filings relative to population in Iowa since 1999. The bankruptcy filing rate there has been lower than the national average. FILINGS PER 1,000 POPULATION
TOTAL CASES FILED IN MINNESOTA PER 1,000 POPULATIONCALENDAR YEARS 1999 - 2009 This chart shows bankruptcy filings relative to population in Minnesota since 1999. The bankruptcy filing rate there has been lower than the national average. FILINGS PER 1,000 POPULATION
TOTAL CASES FILED IN MISSOURI PER 1,000 POPULATIONCALENDAR YEARS 1999 - 2009 This chart shows bankruptcy filings relative to population in Missouri since 1999. The bankruptcy filing rate there has generally been a little above the national average. FILINGS PER 1,000 POPULATION
TOTAL CASES FILED IN NEBRASKA PER 1,000 POPULATIONCALENDAR YEARS 1999 - 2009 This chart shows bankruptcy filings relative to population in Nebraska since 1999. The bankruptcy filing rate there has been very close to the national average for the last four years. FILINGS PER 1,000 POPULATION
TOTAL CASES FILED IN NORTH DAKOTA PER 1,000 POPULATIONCALENDAR YEARS 1999 - 2009 This chart shows bankruptcy filings relative to population in North Dakota since 1999. The bankruptcy filing rate there has been well below the national average. FILINGS PER 1,000 POPULATION
TOTAL CASES FILED IN SOUTH DAKOTA PER 1,000 POPULATIONCALENDAR YEARS 1999 - 2009 This chart shows bankruptcy filings relative to population in South Dakota since 1999. The bankruptcy filing rate there has been well below the national average. FILINGS PER 1,000 POPULATION
TOTAL CASES FILED IN ALASKA PER 1,000 POPULATIONCALENDAR YEARS 1999 - 2009 This chart shows bankruptcy filings relative to population in Alaska since 1999. The bankruptcy filing rate there has been well below the national average. FILINGS PER 1,000 POPULATION
TOTAL CASES FILED IN ARIZONA PER 1,000 POPULATIONCALENDAR YEARS 1999 - 2009 This chart shows bankruptcy filings relative to population in Arizona since 1999. The bankruptcy filing rate there was above the national average in 2009. FILINGS PER 1,000 POPULATION
TOTAL CASES FILED IN CALIFORNIA PER 1,000 POPULATIONCALENDAR YEARS 1999 - 2009 This chart shows bankruptcy filings relative to population in California since 1999. The bankruptcy filing rate there was above the national average in 2009. FILINGS PER 1,000 POPULATION
TOTAL CASES FILED IN HAWAII PER 1,000 POPULATIONCALENDAR YEARS 1999 - 2009 This chart shows bankruptcy filings relative to population in Hawaii since 1999. The bankruptcy filing rate there has been lower than the national average. FILINGS PER 1,000 POPULATION
TOTAL CASES FILED IN IDAHO PER 1,000 POPULATIONCALENDAR YEARS 1999 - 2009 This chart shows bankruptcy filings relative to population in Idaho since 1999. The bankruptcy filing rate there has generally been higher than the national average. FILINGS PER 1,000 POPULATION
TOTAL CASES FILED IN MONTANA PER 1,000 POPULATIONCALENDAR YEARS 1999 - 2009 This chart shows bankruptcy filings relative to population in Montana since 1999. The bankruptcy filing rate there has been lower than the national average. FILINGS PER 1,000 POPULATION
TOTAL CASES FILED IN NEVADA PER 1,000 POPULATIONCALENDAR YEARS 1999 - 2009 This chart shows bankruptcy filings relative to population in Nevada since 1999. The bankruptcy filing rate there has generally been well above the national average. FILINGS PER 1,000 POPULATION
TOTAL CASES FILED IN OREGON PER 1,000 POPULATIONCALENDAR YEARS 1999 - 2009 This chart shows bankruptcy filings relative to population in Oregon since 1999. The bankruptcy filing rate there has been near the national average for the last four years. FILINGS PER 1,000 POPULATION
TOTAL CASES FILED IN WASHINGTON PER 1,000 POPULATIONCALENDAR YEARS 1999 - 2009 This chart shows bankruptcy filings relative to population in Washington since 1999. The bankruptcy filing rate there has been close to the national average for the last five years. FILINGS PER 1,000 POPULATION
TOTAL CASES FILED IN COLORADO PER 1,000 POPULATIONCALENDAR YEARS 1999 - 2009 This chart shows bankruptcy filings relative to population in Colorado since 1999. The bankruptcy filing rate there has been above the national average in five of the last six years. FILINGS PER 1,000 POPULATION
TOTAL CASES FILED IN KANSAS PER 1,000 POPULATIONCALENDAR YEARS 1999 - 2009 This chart shows bankruptcy filings relative to population in Kansas since 1999. The bankruptcy filing rate there has generally been very close to the national average. FILINGS PER 1,000 POPULATION
TOTAL CASES FILED IN NEW MEXICO PER 1,000 POPULATIONCALENDAR YEARS 1999 - 2009 This chart shows bankruptcy filings relative to population in New Mexico since 1999. The bankruptcy filing rate there has been lower than the national average. FILINGS PER 1,000 POPULATION
TOTAL CASES FILED IN OKLAHOMA PER 1,000 POPULATIONCALENDAR YEARS 1999 - 2009 This chart shows bankruptcy filings relative to population in Oklahoma since 1999. The bankruptcy filing rate there has been below the national average for the last three years. FILINGS PER 1,000 POPULATION
TOTAL CASES FILED IN UTAH PER 1,000 POPULATIONCALENDAR YEARS 1999 - 2009 This chart shows bankruptcy filings relative to population in Utah since 1999. The bankruptcy filing rate there has generally been well above the national average. FILINGS PER 1,000 POPULATION
TOTAL CASES FILED IN WYOMING PER 1,000 POPULATIONCALENDAR YEARS 1999 - 2009 This chart shows bankruptcy filings relative to population in Wyoming since 1999. The bankruptcy filing rate there has been lower than the national average. FILINGS PER 1,000 POPULATION
TOTAL CASES FILED IN ALABAMA PER 1,000 POPULATIONCALENDAR YEARS 1999 - 2009 This chart shows bankruptcy filings relative to population in Alabama since 1999. The bankruptcy filing rate there has been well above the national average. FILINGS PER 1,000 POPULATION
TOTAL CASES FILED IN FLORIDA PER 1,000 POPULATIONCALENDAR YEARS 1999 - 2009 This chart shows bankruptcy filings relative to population in Florida since 1999. The bankruptcy filing rate there was above the national average in 2009. FILINGS PER 1,000 POPULATION